Severe Tropical Cyclone Debbie: Insights Resulting from RMS Support of the SWIRLnet Project
Callum HigginsJune 21, 2017
In what was an otherwise relatively quiet Australian cyclone season, Cyclone Debbie proved to be the exception, being the only severe tropical cyclone to make landfall. Although devastating for those affected, Debbie provided an opportunity to help better understand cyclones in the region and the damage they cause.
The Cyclone Testing Station at James Cook University (with collaborators from the Wind Research Laboratory at the University of Queensland) were able to deploy portable weather stations in advance of the event as part of its SWIRLnet (Surface Weather Relay and Logging Network) project, of which RMS is a benefactor.
These stations collected wind speed measurements continuously before, during and after landfall, providing accurate data to help calibrate a wind hazard footprint to assist clients in understanding the event, allowing RMS to estimate the return period of the wind hazard at these sites, and ultimately enhance RMS modeling.
A Category 4 Severe Tropical Cyclone (Australian Scale) Makes Landfall Near Airlie Beach
Forming in the North Coral Sea on March 22, approximately 125 kilometers (km) (77 miles) southeast of Papua New Guinea, the tropical low that would become Severe Tropical Cyclone Debbie intensified to a Category 1 tropical cyclone on the Australian Bureau of Meteorology (BoM) cyclone scale, equivalent to a tropical storm on the Saffir-Simpson Hurricane Wind Scale (SSHWS), on March 25 over the Coral Sea Islands. Debbie was the fifth named storm of the season.
Debbie was steered west-southwest towards the Queensland coastline by a mid-level ridge to the south and an upper-level trough moving north into southeast Queensland. Environmental conditions were favorable for rapid intensification. The system passed through a region of weak vertical wind shear over sea surface temperatures in excess of 29 degrees Celsius, and rapidly intensified to a Category 4 severe tropical cyclone on the Australian scale (Category 3 on the SSHWS) by March 27.
Prior to landfall, the storm underwent an eyewall replacement cycle, with the original inner eyewall beginning to decay as a secondary concentric outer eyewall began to form. This, along with land interaction in the southwestern quadrant, likely prevented intensification as the storm approached the coastline and made landfall.
Nevertheless, Debbie made landfall as a Category 4 severe tropical cyclone on the Australian scale, equivalent to a Category 3 or 4 storm on the SSHWS, near Airlie Beach at midday on March 28.
SWIRLnet Weather Station Data Enhanced RMS Event Response Products
The highest recorded wind speed from Debbie was from the Bureau of Meteorology’s (BoM) automated weather station on Hamilton Island, just 15 km (10 miles) south-east of Airlie Beach, where wind gusts of up to 263 kilometers per hour (km/h) (163 miles per hour) were recorded. However, it should be noted that this weather station is located on a hill with ocean exposure, resulting in readings that are considerably higher (by an order of 30 percent) than would be measured over standard flat open land terrain. On the mainland, the maximum gust recorded was 165 km/h (102 miles per hour) at Proserpine Airport, 24 km (15 miles) southwest of Airlie Beach.
In total, six SWIRLnet towers (3.2-meter-high anemometers) were deployed in communities likely to be affected in advance of Cyclone Debbie; three in the Ayr and Home Hill region, two in Bowen and one in Proserpine.
As a benefactor of the SWIRLnet program, RMS was able to make use of this detailed data in order to constrain our wind hazard footprint for the event, and also feed into the stochastic track selections for the storm in the aftermath of the event. With Cyclone Debbie being the most viewed event on RMS Owl since Hurricane Matthew in October 2016, this data proved invaluable in providing the most accurate event response products to our clients as possible.
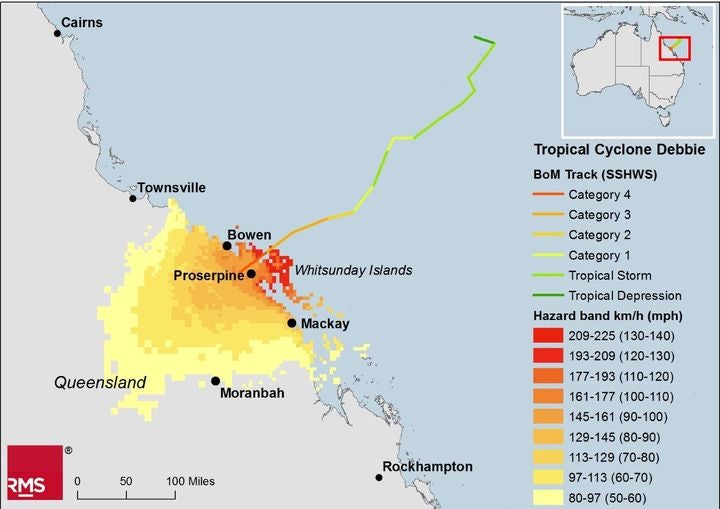
RMS banded wind hazard map (3-second peak gust) for Cyclone Debbie with the Bureau of Meteorology (BoM) track overlain
As the banded wind hazard map above reveals, although Cyclone Debbie was a strong Category 3 to weak Category 4 storm on the SSHWS upon landfall and impacted the Whitsunday Islands with strong Category 3 winds, in Proserpine and Bowen, wind gusts were equivalent to Category 1 and in other nearby populated areas such as Mackay, the wind speeds experienced were only tropical storm strength.
Reports from the Cyclone Testing Station Provided a Clear View of the Wind Damage
The wind hazard data was reflected in the wind damage observed from the storm, with the majority of severe damage found in Hamilton Island and Airlie Beach. Cases of structural wind damage were observed in Proserpine and Bowen also, but only minor wind related damages were experienced in Mackay.
Structural damage predominantly consisted of damage to roof cladding and failure of the supporting roof framing connections. However, other sources of damage are also likely to be a driver of wind losses for this event, with widespread water damage from water ingress and observations of minor damage to appurtenant structures, fencing and outdoor furniture providing a reminder that these are additional important sources of loss to consider when evaluating vulnerability of a property to wind in Australia.
Detailed damage information on Cyclone Debbie from field reports by qualified wind engineers from the Cyclone Testing Station increased the resolution of wind damage information RMS was able to share with clients in the aftermath of the event and will be used to inform vulnerability development for the RMS® Australia Cyclone model.
Forty Year Return Period Winds Experienced in Proserpine and Bowen
Measurements from the SWIRLnet towers proved an additional useful reference point to examine the return period of the wind speeds experienced in different locations. By running locations with the coordinates of the SWIRLnet towers through the current Australia Cyclone Model and adjusting wind speeds appropriately for height and terrain to make a fair comparison between observed wind speeds and RMS model output, estimates of the return period of the cyclone winds experiences from Debbie at these locations were calculated.
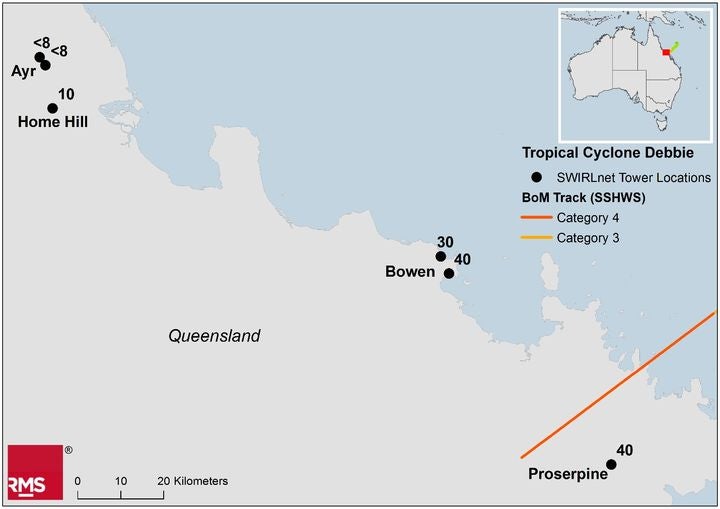
Locations of the deployed SWIRLnet towers are highlighted and the associated return periods (years) of their maximum recorded wind speeds for Cyclone Debbie calculated using RMS Australia Cyclone Model output are listed. The BoM track for Cyclone Debbie is overlain.
The results reveal that wind speeds experienced in Proserpine represent approximately a 40-year return period wind speed for the town with a similar return period of wind speeds also experienced in Bowen. Further north in the Ayr and Home Hill area, the return period of winds experienced were around ten years.
Possible Post-Event Loss Amplification in the Aftermath of the Event
Many residents in the region are still rebuilding from the damage over two months on and Asia Insurance Review writes that there have been anecdotal reports of tradesmen charging up to a 400 percent mark-up on rebuilding costs in some cases. Building companies and the Insurance Council of Australia said that the higher costs were due to supply and demand with limited labor and materials in hard hit areas and the logistics of flying in tradesmen from down south. How widespread and significant this demand surge really is remains to be seen, but once claims are finalized it will be interesting how consequential, if at all, this is on the total losses.
The updated RMS Australia Cyclone Model targeted for release in 2018 will include explicit modeling of Post-Event Loss Amplification including from such demand surge. In addition, among other updates several recent historical storms including Cyclone Debbie will be added to the event set.
Share:
You May Also Like
December 04, 2023
Windstorm Ciarán: New Enhanced Event Response Benefiting from High-Definition Models
Callum is the product manager for Moody’s RMS Event Response Services (including HWind) and Agricultural Models and is based in London. Most recently he has been focused on improving client workflows through the integration of event response functionality within the Intelligent Risk Platform.
Previously, Callum has worked on climate change initiatives at Moody’s RMS as well as the 2018 update to the Australia Cyclone Model.
Callum is a Certified Catastrophe Risk Analyst and holds an integrated master’s degree (MEarthSci) in Earth Sciences from Oxford University.