What Should We Make of the U.S. Severe Convective Storm (SCS) Season So Far?
Jeff WatersJuly 13, 2017
After a blistering start to the 2017 U.S. severe weather season in which tornado, hail, and wind reports were at near or record levels of activity through to March, recent months have been closer to normal. As of early July, overall observations are still above the 10-year running average (2005-2015), but they’re slowly falling back into the expected bounds.
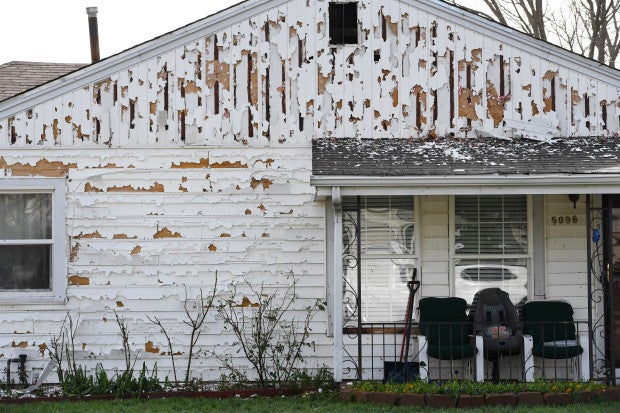
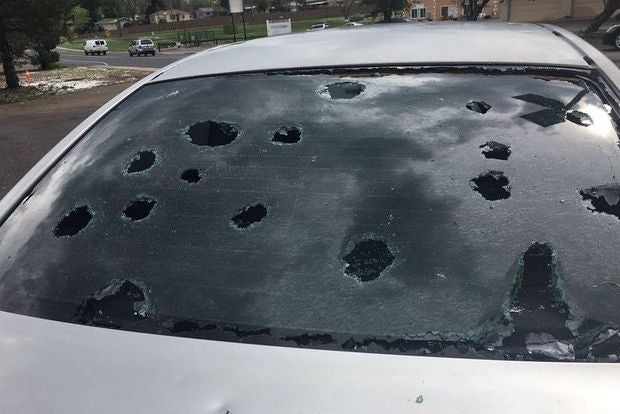
The biggest contributor to this year’s total was the May 8-11 outbreak, which brought a combination of large hail, damaging winds, and tornadoes to several states in the Plains and Midwest, causing an estimated $1.7 billion in insured losses. Most of the damage was driven by a hailstorm in the Denver, Colorado Metro area, which caused an estimated $1.4 billion in insured losses (Pictures 1 and 2).
Picture 1: A home near 51st Avenue and Clay Street, a mile northwest of the center of Denver, Colorado, one of many that sustained major hail damage from a storm on May 9, 2017. Source: Andy Cross/The Denver PostPicture 2: Hail damage to a car, around a mile west of Denver city center. Source: Twitter @JessicaLebelWX
It is likely to become the costliest insured catastrophe in Colorado’s history. Depending on how the rest of the year unfolds, 2017 could mark the second consecutive year where the costliest SCS event is driven by hail. In 2016, two severe hailstorms impacted Texas in March and April causing an estimated $4.7 billion in insured losses. The April event in San Antonio caused an estimated $3 billion in insured losses alone, surpassing the 2010 Phoenix hailstorm as the costliest hailstorm in U.S. history.
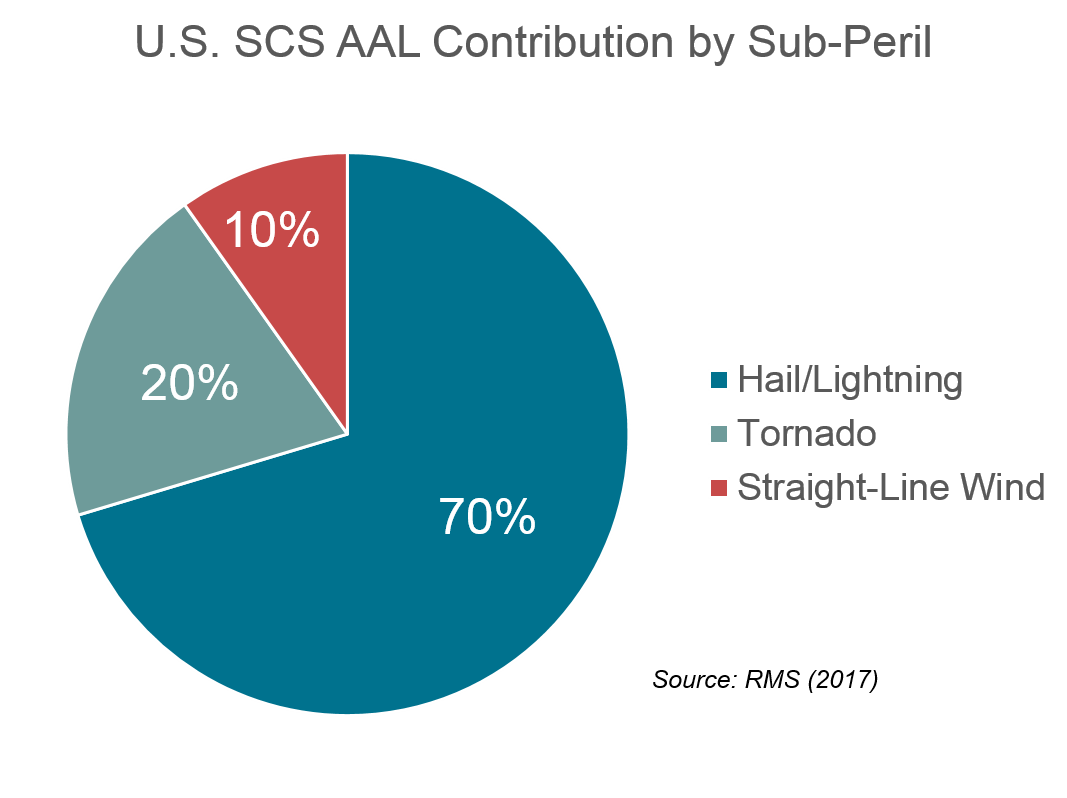
From a RMS modeling perspective, this is in line with annual SCS sub-peril contribution to losses. Hail drives the majority of U.S. SCS average annual insured losses (AAL) for the industry, followed by tornado and straight-line winds (Figure 1). Hail events are common and possess larger footprints compared to tornadoes and straight-line winds. At larger return periods, however, tornadoes drive the majority of the loss given their low frequency, but high severity impacts.
Figure 1: U.S. Severe Convective Storm Annual Average Loss contribution by sub-peril
However, it’s worth noting that the 2017 season has been characterized by more than a few events. In addition to the Colorado hailstorms, according to Property Claims Services, more than 20 other SCS events have occurred throughout the Plains, Midwest, Southeast, and Mid-Atlantic regions this year, only three of which caused more than $1 billion in insured losses. This high prevalence of small-to-medium sized events, not to mention the additional impacts of higher frequency, or non-catastrophe-level events, signifies that aggregated losses from multiple events can have just as much of an impact as extreme losses from a few low-frequency, high severity events.
Is SCS now the Costliest Peril in the U.S.?
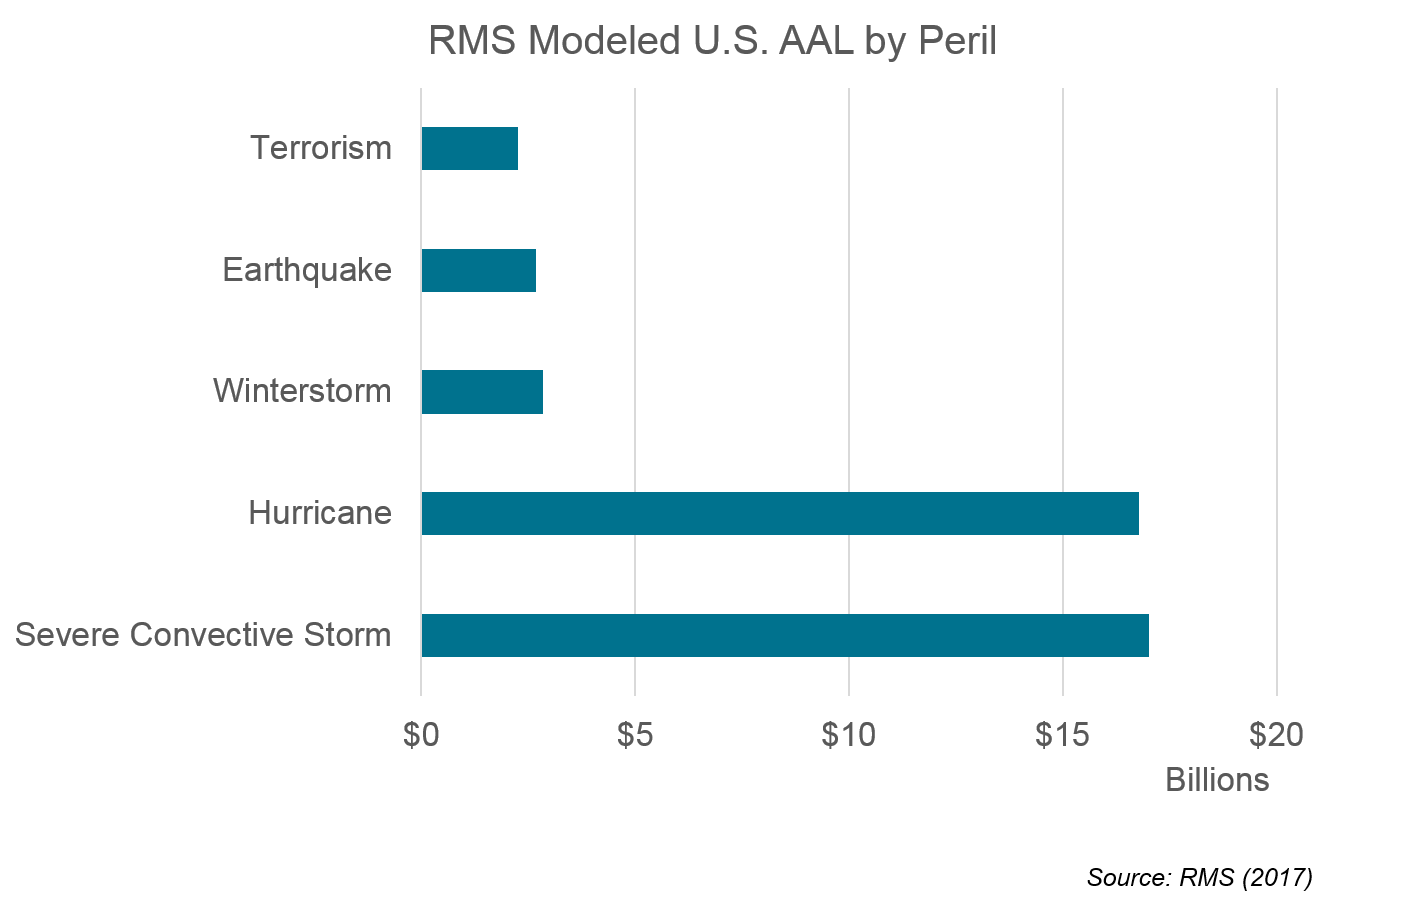
Given the recent uptick in activity and losses, is severe weather now considered to be the costliest peril in the U.S.? It depends on which time-period you compare against, but based on recent years the answer is yes. Since 2006, average annual insured losses from hail, tornadoes, and straight-line winds have been about twice as much ($12.5 billion) as those from tropical cyclones ($6.2 billion), according to the Insurance Information Institute. If you extend the period to 2003-2015, which includes losses from the active 2004-2005 Atlantic hurricane seasons, there is more parity. This view is supported by RMS as well. According to the recently-released 2017 RMS U.S. Hurricane and U.S. Severe Convective Storm Industry Loss Curves, modeled average annual industry losses from SCS events are now slightly higher than hurricane.
Figure 2: U.S. Modeled Annual Average Loss by Peril
It begs the question though, what is driving this shift in the SCS risk landscape? Is it just a function of fewer landfalling tropical cyclones, or is there a more discernable connection between factors like event frequency, severity, and exposure? And how much of a role does climate change play in all of this?
Sound SCS Risk Management Goes Beyond the Historical Record
Regardless of what the driving factors are, it’s clear that past hazard and loss patterns may not be reflective of those in the future. Historical experience, while important, may lead to inadequate use of capacity, over or under-representation of the current risk profile or exposures at risk, inefficient claims management practices, or misinformed reinsurance purchasing decisions. Thus, sound SCS risk management needs to consider the historical data and loss record, but also the events that haven’t happened yet but could, and the drivers and impacts of a shifting risk landscape. Having a more comprehensive understanding of SCS risk could mean the difference between persistent erosion of a carrier’s bottom-line versus profitable risk selection, differentiation, and portfolio management strategies.
With new legislation (granted, amidst proposed budget cuts), innovative research, and data availability, our understanding of severe weather is poised to improve. Having a more accurate understanding of the atmospheric variables that drive severe weather allows RMS and model vendors alike to develop more accurate SCS probabilistic catastrophe models, data products, and more timely event response services, helping the (re)insurance industry to better understand near-term SCS risk in the most severe weather-prone region in the world.
What does this severe weather season mean to you and your business? Perhaps a better question to ask is – what steps are you taking to quantify and manage severe weather risk effectively?
Share:
You May Also Like
September 27, 2023
Moody’s RMS North Atlantic Hurricane Models: Five Reasons Why Version 23 is the Right Model to Navigate a Challenging Market
Staff Product Manager, Model Product Management, Moody's RMS
Jeff Waters joined Moody's RMS in 2011 and is based in Bethlehem, PA. As part of the Product Management team, he is responsible for product management of the Moody's RMS North Atlantic Hurricane Models.
Jeff provides technical expertise and support regarding catastrophe model solutions and their applications throughout the (re)insurance industry. He also generates product requirements for future updates and releases, and helps develop the overall product strategy, messaging, thought leadership, and collateral to ensure its commercial and technical success.
Waters’ background is meteorology and atmospheric science with a focus in tropical meteorology and climatology. Jeff holds a B.S. in Geography/Meteorology from Ohio University (’09), and a M.S. in Meteorology from Penn State University (’11). He is a member of the American Meteorological Society, the International Society of Catastrophe Managers, and the U.S. Reinsurance Under 40s Group, Inc