Risk Modeler 1.11 Release: Accelerating Access to Powerful Insights From the RMS U.S. Inland Flood HD Model
Meghan PurdyMay 09, 2019
The April release of Risk Modeler 1.11 marks a major milestone in both model science and software. For the first time at RMS, a complete high-definition (HD) model – the RMS U.S. Inland Flood (USFL) HD model with integrated storm surge, and an accompanying model validation workflow are now available to all users on the new platform. It also marks the release of exciting new capabilities including auditable exposure edits and data access via third-party business intelligence and database tools.
What is Different About Model Validation on Risk Modeler?
For the USFL model to produce detailed insights into risk, it must realistically simulate the interactions between antecedent environmental conditions, event clustering, exposures, and insurance contracts over tens of thousands of possible timelines. That requires a new financial engine, a more powerful model execution engine, and a purpose-built database to handle the processing of and metrics calculation against the vast amounts of data that an HD model produces. Although the current RiskLink solution can perform some of these tasks and processes well and efficiently, Risk Modeler was especially built for these new requirements.
In addition to simply running this next-generation model, Risk Modeler has several features to quickly surface insights into the model and ultimately allow users to make business decisions faster.
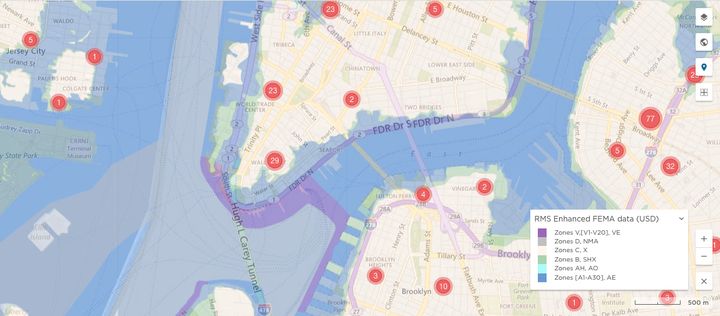
1) Integrated Maps and Analytics: Dashboards and maps help users analyze exposure alongside the results. For example, users can overlay their exposures and the FEMA flood zones on a map, then run accumulations to understand their exposed limit in each zone.
Image 1: FEMA flood zones overlaid on a map of a portfolio’s risk items.
Or users might quickly generate maps of their USFL Annual Average Loss (AAL) state-by-state inside the application, instead of exporting data to mapping tools such as ArcGIS, making the process more seamless, saving time, and reducing the chance of error.
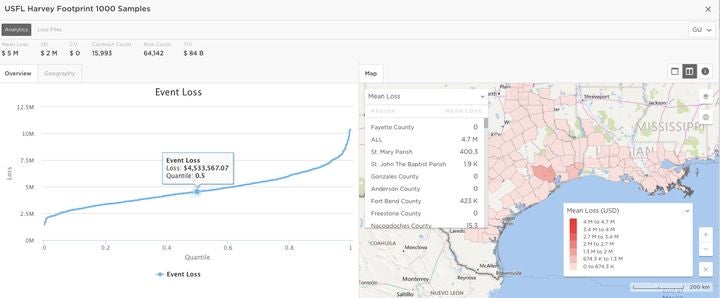
2) All Results From All Model Permutations: The RMS Platform is purpose-built for risk analytics, with swift read/write capabilities and a state-of-the-art model execution and analytics engine. This is especially critical for model validators, who must first generate large amounts of data before distilling insights from the output.
Image 2: Understanding the range of losses from the Harvey footprint by sampling a thousand times.
In RM 1.11, users can run all flavors of the model (Exceedance Probability – EP / scenario / historical / footprint; simulated / expected; with and without storm surge; and much more), test convergence with period count and sampling options, and produce metrics including location-level period loss tables (PLTs), intermediate hazard and damage, and more. These results can be downloaded, though users are encouraged to take advantage of the querying capabilities of the notebook, which is built on big data technology to execute queries quickly.
3) Contributory Metrics: Model validators can take advantage of powerful metrics in Risk Modeler to help them extract insights about their data faster.
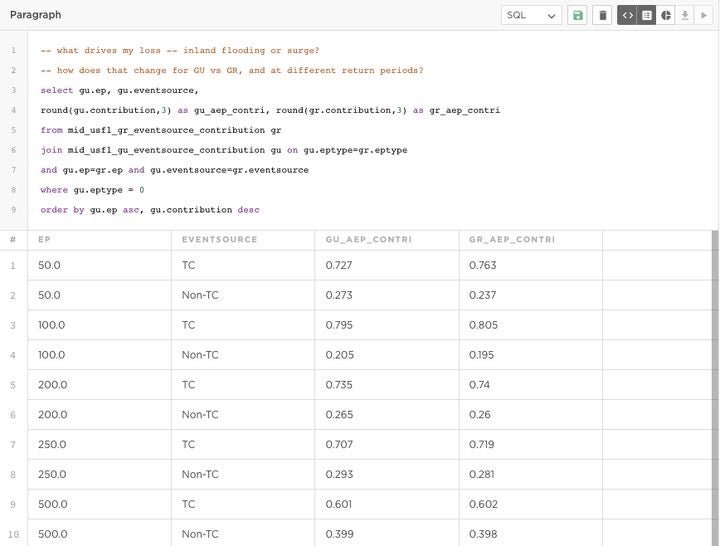
In addition to the usual PLT, EP curves, and AAL, users can request contributory and correlation metrics in the notebook. Contributory metrics are much more powerful than AAL because they provide contribution of a segment to portfolio loss at key return periods — and it is those return period losses that drive capital requirements and reinsurance premiums.
RM 1.11 also adds new levels of detail at which these metrics can be calculated: by river basin, FEMA flood zone, and flood source, i.e., tropical cyclone or non-tropical cyclone flood-driven, in addition to geographic and building attributes. Thus, model validators can understand how hurricanes contribute to, for example, their 50-year inland flood Occurrence Exceedance Probability (OEP) and how that changes as you move out on the EP curve.
Image 3: Querying the contribution of tropical cyclone and non-tropical cyclone-induced flood events to GU and GR loss at different return periods.
What Else is Available?
The RM 1.11 release includes several advancements that make the platform more open and flexible:
1) New Exposure Views: Understand and query contract terms and conditions.
2) Edits: Edit risk item attributes, save them as variations of existing portfolios, and track changes in an audit trail.
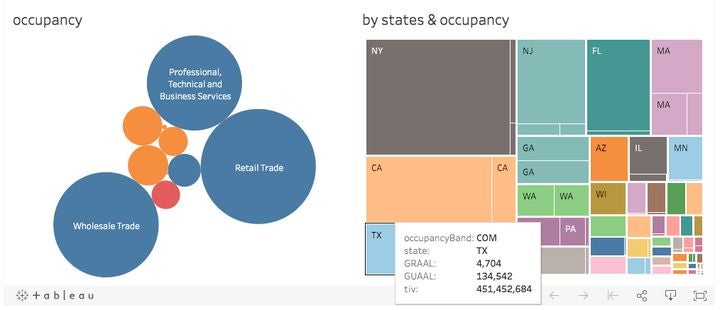
3) JDBC/ODBC Access: Use JDBC/ODBC connections to interact with exposure and results data from tools including Tableau, Excel, DbVisualizer, and Hive.
Image 4: Visualizing Total Insurable Value (TIV) using Tableau.
Edits and JDBC/ODBC access are being released as preview features in RM 1.11. Client feedback is a core tenet of our product development model. As such, we now showcase features earlier in our development cycle in order to gather and then incorporate customer feedback before the official launch. If you have feedback on these preview features, please contact us via your RMS account representative or leave feedback directly in the application via UserVoice.
These features are just the tip of the iceberg. At our Exceedance conference next week, we will cover these exciting features and provide a sneak peek of what’s to come. If you are attending, join the RMS Software track presentations or drop by the Expert Bar to hear more. Licensing clients can also see the full suite of capabilities on RMS Owl.
Share:
You May Also Like
November 11, 2013
Will it Blend? (…And Now What?)
In previous posts on multi-modeling, Claire Souch and I discussed the importance of validating models and the principles of model blending. Today we consider more practical issues: how do you blend, and how does it affect pricing, rollup, and loss investigation?
No approach to blending is superior. There...
My colleague Claire Souch recently discussed the most important step in model blending: individual model validation. Once models are found suitable—capable of modeling the risks and contracts you underwrite, suited to your claims history and business operations, and well supported by good science and...
Meghan has been with RMS since 2009 covering data quality analytics, model analytics and change management, and, since 2014, software product management. Based in California, she works with software engineers, designers, and users to build fast, user-friendly solutions for underwriting analytics, ad hoc analytics, and data import/export for applications on the RMS platform. Meghan holds a bachelor’s degree in earth and planetary sciences from Harvard University.