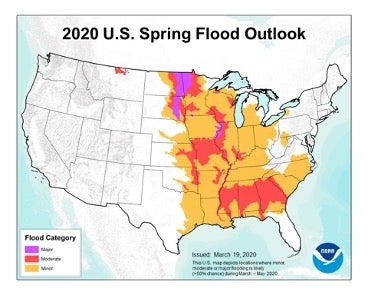
According to the spring flood outlook released by the National Oceanic and Atmospheric Association (NOAA), a third of the United States is at risk of inland flooding this spring – that’s roughly 1.26 million square miles, covering 23 states and affecting almost 130 million Americans (Cappucci). Spring floods in the U.S. are often brought on by snowmelt, ice jams, and thunderstorms. Intuitively these make sense as drivers: warmer temperatures lead to snowmelt and river thaws in the North, producing a lot of runoff in a short period of time, while thunderstorms occur frequently across Central and Eastern regions bringing intense rainfall that can generate flash flooding.
While not as severe as 2019, NOAA does expect this season to be above average in temperature and precipitation across the central and eastern portions of the country (NOAA). A number of areas are heading into the spring flood season well ahead on rainfall and snowpack, leading to saturated soils that will have a tougher time handling the downpours that can occur.
Snowmelt could negatively impact agriculture again in the Midwest and Northern regions by delaying planting. In these regions, major flooding is forecasted along sections of the Missouri River, Mississippi River, and the Red River of the North, with the Dakotas and Minnesota projected to be most impacted. The Southeast is also particularly vulnerable as the 2019-2020 meteorological winter was among the top five wettest on record. This has left many cities with saturated soils after having close to 30 inches of rain since the start of the year, and as a result, the& NOAA is forecasting moderate flooding over larger areas of Mississippi, Alabama and Georgia (Cappucci).
Image Source: NOAA
What will the summer and the rest of the year bring?
In addition to the usual considerations of rainfall and snowmelt, a number of less obvious but very important additional factors need to be taken into account. First of all, we need to consider antecedent conditions. For example, if areas prone to hurricanes and tropical storms get a lot of rainfall and melt in the spring, the saturated soil will not be able to absorb the heavy rainfall produced by tropical weather systems, as we saw with Florence (2018) in the Carolinas. Related to this is the impact of consecutive events: even relatively minor events can exacerbate future flooding if they occur in close proximity.
Therefore, as we approach the hurricane season, it is critical to consider flood from all sources, i.e., from tropical, extra-tropical, and convective weather systems, and the potential impacts of previous events.
Secondly, we must consider the impact of flood defenses and mitigation efforts (e.g., levees, diversion channels, dams/reservoirs, etc.). The U.S. river network is estimated to be protected by over 100,000 miles of defenses (USACE) which can mean the difference between a defended flood event or a flood that could cause a serious loss. The latter could be due to a lack of defenses or due to defense failure, as we saw in the Midwest 2019 floods.
However, only about 15-20% of these defenses are publicly documented and even less have information on their level of protection or current condition. As summer stretches into autumn and winter, one factor will become clear: flood defenses matter when it comes to underwriting and managing flood risk. Modeling flood risk without a complete view of flood mitigation measures can bias modeled losses, potentially leading to overly conservative views of flood risk and an inefficient use of capital. Having comprehensive defense information, as well as the ability to quantify sensitivities and impacts of various flood mitigation efforts and failure scenarios, facilitates appropriate flood risk selection, pricing, and portfolio growth decisions.
A model for all seasons!
Regardless of the season, the flood market in the U.S. continues to grow and evolve. How can you confidently underwrite risk in such a varied market for such a spatially high-resolution and temporally complex peril? It may seem obvious – you need a solution that is fit for purpose.
The U.S. Inland Flood HD model is such a solution. It has a long temporal simulation (50,000 years) that generates over 1 million flood events that provide a complete characterization of low- and high-severity events while accounting for event clustering, antecedent conditions, and seasonality. It captures temporal and spatial correlations of flood from all sources—tropical, extra-tropical, and convective weather systems—maintaining a “memory” of events in time and space to ensure preconditions impact subsequent events (e.g., consistent heavy rainfall in spring saturates soil, worsening potential flood extents and depths in summer/fall). And critically, the model not only includes a probabilistic defense model across the entire river network, but also allows defense customization to generate bespoke views and conduct sensitivity analyses enabling competitive pricing.
Because the model has such a large event set, it properly captures a rich set of possible tail events, minimizes what we term “model error” (ensuring loss convergence at fine scales and more accurately representing “reality”), and thus, avoids underestimation of risk. Surprise losses in the tail are the nightmare of any CRO, CUO or CFO, and can have serious financial consequences ranging from the need to purchase additional reinsurance cover to risk of ruin!
Implications for insurance
Although this season may not be as severe as last year’s, there may still be significant events causing substantial damage and loss. For those needing or seeking insurance, a large flood insurance gap remains. The highest flood insurance penetration is along the coast and major rivers in Special Flood Hazard Areas (i.e., flood zone groups A and V) designated by FEMA Federal Insurance Rate Maps (FIRMs); however, flooding often occurs outside these areas, which leads to sizeable uninsured losses.
Last spring, the Congressional Budget Office conducted a study using the RMS U.S. hurricane and flood models to estimate the expected cost of damage from hurricane wind and storm related-flooding along with data from the Federal Emergency Management Agency, the Department of Housing and Urban Development, the Small Business Administration, and the Office of Management and Budget. They found that of the $20 billion estimated annual residential flood losses (inland and coastal), roughly two-thirds are left uncompensated (CBO).
There has been a lot of discussion on how the FEMA FIRMs are outdated and have led to National Flood Insurance Program (NFIP) rates that are not adequately priced to the actual risk. However, the NFIP and FEMA are working to improve the rates in Risk Rating 2.0 with the help of catastrophe model vendors, including RMS.
The RMS U.S. Inland Flood HD Model and associated data products [U.S. Flood Depth Data, Susceptibility Data, Loss Costs, and Risk Scores] can help assess the current flood risk landscape at a granular resolution, providing the necessary insights to grow the flood insurance market and fill the protection gap. Having a thorough understanding of the underlying flood risk can assist in developing new products with appropriate pricing and underwriting guidelines, making sound decisions on growing portfolios with superior risk selection, and responsibly managing those portfolios in the context of your broader business.
Join us at Exceedance 2020 Virtual!
To learn more about the RMS U.S. Inland Flood HD Model and how it leverages the latest modeling science and technology to provide a comprehensive flood solution, be sure to attend Exceedance 2020 and join the session “Leveraging HD Capabilities to Understand Inland Flood Risk” Tuesday, May 5 at 12:30pm EDT, or join us in the Expert Bar to get your detailed flood questions answered.
U.S. Army Corps of Engineers, USACE. “National Levee Safety: About Levees.” USACE Headquarters, https://www.usace.army.mil/National-Levee-Safety/About-Levees/. Accessed 27 April 2020.
Share:
You May Also Like
June 27, 2019
An Award-Winning U.S. Inland Flood Model
It was off to London’s Savoy Hotel for members of the RMS London team last Thursday, for the Eleventh Trading Risk Awards. And apart from the great hospitality, and the flowing conversation from colleagues and industry peers alike, RMS was also recognized by the award judges, receiving the “Initiative of...
Dr. Holly Widen is a Product Manager in the Model Product Management team, focusing on the U.S. Flood suite of products. She joined RMS in 2016 upon completion of her Doctorate in Geography from Florida State University, where she studied tornado risk and vulnerability using applied spatial statistics. She has co-authored over ten peer-reviewed journal articles and is a member of the American Meteorological Society and the American Association of Geographers.