


EXPOSURE
The RMS Magazine with a unique perspective and clear mission “... to provide insight and analysis to help insurance and risk professionals innovate, adapt, and deliver.”

Insurance: The next 10 years
Mohsen Rahnama, Cihan Biyikoglu and Moe Khosravy of RMS look to 2029, consider the…
Times Square, New York City
Tag: ISSUE 1

The Next Big One?
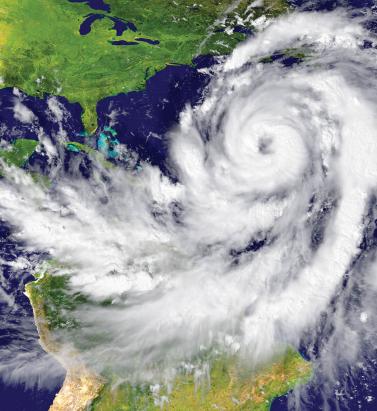
July 25, 2016Rather than waiting for the next elusive hard market, successful (re)insurers are focusing on making informed underwriting decisions and taking well-calculated risks, according to Ben Brookes, managing director – capital and resilience solutions, RMS. A popular topic of conversation at the big industry gatherings is when the next “big one” will occur. What size and nature of loss could reverse the softening trend and see a return to hard market pricing? The influx of alternative capital into the reinsurance market over the past decade has transformed the traditional reinsurance cycle with no guarantee a market peak will follow the current trough. Insured catastrophe losses over the past few years have been significantly below average, particularly in comparison to major loss years such as 2005 and 2011. The majority of large-scale events during this time have resulted in a relatively low level of insurance claims due to the fact they have occurred in areas where insurance penetration is low. “THERE IS SIGNIFICANT DOUBT OVER WHETHER A U.S. HURRICANE LANDFALLING ON ITS OWN COULD TURN THE MARKET – PARTICULARLY BECAUSE U.S. HURRICANE IS ONE OF THE BEST-UNDERSTOOD AND WELL-MODELED PERILS, MAKING THIS A SCENARIO THE MARKET CAN MANAGE.” Recent frequency of North Atlantic hurricanes, typically a significant driver of insurance industry catastrophe losses, has been below average, with 2015’s record El Niño one factor behind the low number of tropical cyclones. These conditions have resulted in a protracted soft market, in addition to excess capacity and heightened competition within the reinsurance sector. There is significant doubt over whether a U.S. hurricane on its own could turn the market – particularly because U.S. hurricane is one of the best-understood and well-modeled perils, making this a scenario the market can manage. What we do know is that market-changing events are often surprise losses, revealing unknown accumulations lurking in reinsurance portfolios. Historical examples included Hurricane Katrina’s ability to overcome the defenses in New Orleans and the 9/11 terrorist attacks on the New York World Trade Center. A surprise event is the one you don’t see coming and is the one most likely to change the market. Given the quickly evolving nature of emerging risks such as cyber and pandemic, in addition to more traditional perils, such a loss could arise from numerous sources. Increasing insurance penetration in emerging markets has increased the assets-at-risk of natural catastrophes and the potential for major losses from regions that have been traditionally regarded as “non-peak.” “IT THEREFORE APPEARS INCREASINGLY UNLIKELY THE INDUSTRY WILL AGAIN SEE A MARKET ADJUSTMENT ON THE SCALE THAT WAS LAST WITNESSED IN 2001 AND 2005 DUE TO THE INDUSTRY’S FUNDAMENTALLY ALTERED CAPITAL STRUCTURE.” Given the way in which the industry has changed and the ability of capital to move quickly into the industry post-event, even a major shock or series of shocks may not have the same impact on the reinsurance cycle that it did in the past. Insurance-linked securities (ILS) fund managers continue to line up capital ready to be deployed the minute there is any indication of price hardening. It therefore appears increasingly unlikely the industry will again see a market adjustment on the scale that was last witnessed in 2001 and 2005 due to the industry’s fundamentally altered capital structure. While this is a good thing in terms of the structural integrity of the market, it also means reinsurance companies are faced with the prospect that current soft market conditions will continue to prevail and are, in essence, the new normal. In such an environment, risk selection and risk-adequate pricing are all-important, and there is very little margin for error. Competition in the reinsurance space is now a race to broaden insurance coverage, searching for new business in new territories and risk classes, rather than a race to the bottom with reinsurers competing on price alone. Modeling, data and analytics offer a competitive advantage to those reinsurers that use them to make informed decisions and take informed risks. Underwriters are scrutinizing model output more than ever before, overlaying their own assumptions and risk tolerance and looking for unexpected correlations between books of business to avoid being disproportionately impacted by any one event, and avoiding the private catastrophe. The ability to customize and blend multiple models allows users to tailor the models to their own view of risk, and complement and build on the insights from sophisticated exposure and accumulation management techniques, with increasingly real-time views of portfolio risk. Driving value out of these model output-based decisions will be the main differentiator as reinsurers navigate and make sense of the new reinsurance environment. For instance, one such opportunity is the ability to understand the “spatial correlation” of European flood risk in order to gain a diversification benefit and make quick and strategic M&A decisions by analyzing exposure data in real time. In a market coming to terms with this “new normal” of lower margins, but serving an increasingly important role in creating a safer society through broader coverage, the importance of effective catastrophe risk quantification and management has never been greater.
Learning From New Zealand to Avoid Surprises
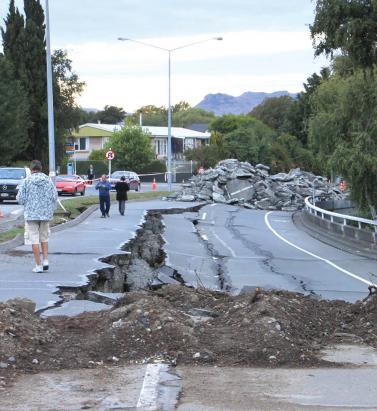
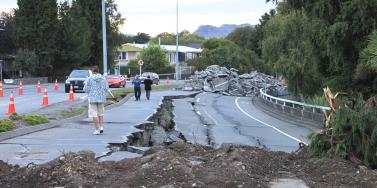
July 25, 2016Secondary hazards, such as liquefaction, and the earthquake sequencing that hit the low-seismicity area of Canterbury, New Zealand, in 2010 and 2011 contributed significantly to the overall loss figures, explains RMS seismology expert Megan Arnold. The phenomenon of “loss creep” has long been an issue associated with major catastrophes, and slight revisions in expected losses are to be expected. However, when unanticipated losses occur and an insurance or reinsurance company radically revises its loss figures upwards there can be a detrimental impact on the business. “When unanticipated losses occur and an insurance or reinsurance company radically revises its loss figures upwards there can be a detrimental impact on the business.” While catastrophe models and exposure management tools have evolved considerably, every major catastrophe is a necessary learning experience. This includes the 2010 and 2011 Canterbury earthquake sequence in New Zealand. Figure 1. Example of liquefaction that caused significant damage to buildings during the Canterbury earthquake sequence. The photo was taken during the RMS reconnaissance trip to Christchurch after the February 22, 2011, earthquake. The magnitude 7.1 earthquake in September 2010 on an unknown fault in Canterbury, which was previously thought to be a low seismic-hazard area, caused surprisingly widespread damage, but no loss of life. This started a sequence of 17 loss-causing earthquakes in the region, lasting over a year. It was the magnitude 6.3 event – right beneath the city of Christchurch on February 22, 2011 – that proved deadly. Many buildings that had been damaged and weakened in earlier quakes were reduced to rubble, and 182 people died. In addition to this low-seismicity area suddenly experiencing earthquake shake damage, the main unanticipated losses were from the unprecedented amount of liquefaction, when saturated or partially saturated soil substantially loses strength causing it to behave like a liquid. This phenomenon produced so much damage that thousands of residential homes in the region were found to be situated on land with liquefaction susceptibility too hazardous for repairs or rebuilding. They were subsequently designated within the government red zone and demolished. The impact of repeated events and the large amount of liquefaction created progressive damage during the 2010-2011 Canterbury earthquake sequence, significantly confusing the loss picture and prolonging the loss adjusting and claims settlement process. The New Zealand Earthquake Commission (EQC) and private insurers are still settling outstanding Canterbury earthquake claims five years later. “These important enhancements to the model’s liquefaction loss component offer a more precise tool with which to gauge the likely impact of this secondary earthquake hazard on a book of business.” The 2010-2011 earthquakes presented an important opportunity to learn more about the behavior of liquefaction. The Natural Hazards Research Platform, EQC and many local agencies in New Zealand funded the collection of liquefaction observation data across Christchurch. This extensive, high-quality data reveals several key observations, including: The spatial extent of the observed liquefaction during the February 2, 2011, M6.3 event corresponds well to the shallow groundwater zones in the area of Christchurch, but not where the groundwater is deeper. The observations confirm that groundwater depth is an important factor in predicting liquefaction initiation. There is significant spatial variation in the liquefaction-related ground displacements over short distances. To account for these large differences in severity over short distances, the modeling methods need to map liquefaction severity parameters for localized variations where possible. Two primary failure mechanisms cause the severe ground displacements, predominantly vertical deformation as well as more laterally induced ground displacement. The Christchurch liquefaction data shows a probable correlation between ground displacement severity and damage. Lateral deformation is found to be more damaging than vertical displacement. Figure 2. Example of lateral spreading that caused severe damage to buildings and infrastructure in Christchurch during the February 22, 2011, earthquake. The photo was taken during the RMS reconnaissance trip to Christchurch. Learning from the earthquakes using observational data and our own research, RMS incorporates four innovations in liquefaction loss modeling into the RMS® New Zealand Earthquake HD Model to help firms better predict the occurrence and severity of liquefaction: Innovation 1: New geospatial methods that map groundwater-well data and near-surface groundwater depth to better determine regions of high liquefaction susceptibility across the country, including low-seismicity areas. Innovation 2: New geospatial methods that use site-specific liquefaction borehole data to create maps that delineate liquefaction initiation potential and severity parameters. Innovation 3: New methods of predicting where liquefaction could result in horizontal displacement. Innovation 4: New analysis of empirical building fragility to liquefaction based on the Christchurch observation data and insurance claims. These important enhancements to the model’s liquefaction loss component offer a more precise tool with which to gauge the likely impact of this secondary earthquake hazard on a book of business by enabling firms to predict a more granular scale loss from liquefaction. The developments have improved how RMS earthquake models determine the spatial pattern of liquefaction initiation, the liquefaction severity at the ground surface (if initiated) and expected building responses to liquefaction-induced ground displacements.

Beware the Private Catastrophe
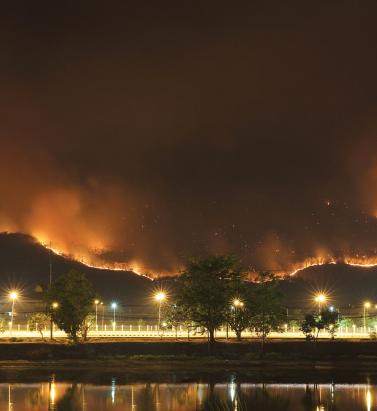
July 25, 2016Having a poor handle on the exposure on their books can result in firms facing disproportionate losses relative to their peers following a catastrophic event, but is easily avoidable, says Shaheen Razzaq, senior director – product management, at RMS. The explosions at Tianjin port, the floods in Thailand and most recently the Fort McMurray wildfires in Canada. What these major events have in common is the disproportionate impact of losses incurred by certain firms’ portfolios. Take the Thai floods in 2011, an event which, at the time, was largely unmodeled. The floods that inundated several major industrial estates around Bangkok caused an accumulation of losses for some reinsurers, resulting in negative rating action, loss in share price and withdrawals from the market. Last year’s Tianjin Port explosions in China also resulted in substantial insurance losses, which had an outsized impact on some firms, with significant concentrations of risk at the port or within impacted supply chains. The insured property loss from Asia’s most expensive human-caused catastrophe and the marine industry’s biggest loss since Superstorm Sandy is thought to be as high as US$3.5 billion, with significant “cost creep” as a result of losses from business interruption and contingent business interruption, clean-up and contamination expenses. “While events such as the Tianjin port explosions, Thai floods and more recent Fort McMurray wildfires may have occurred in so-called industry ‘cold spots,’ the impact of such events can be evaluated using deterministic scenarios to stress test a firm’s book of business.” Some of the highest costs from Tianjin were suffered by European firms, with some firms experiencing losses reaching US$275 million. The event highlighted the significant accumulation risk to non-modeled, man-made events in large transportation hubs such as ports, where much of the insurable content (cargo) is mobile and changeable and requires a deeper understanding of the exposures. Speaking about the firm’s experience in an interview with Bloomberg in early 2016, Zurich Insurance Group chairman and acting CEO Tom de Swann noted how due to the accumulation of risk that had not been sufficiently detected, the firm was looking at ways to strengthen its exposure management to avoid such losses in the future. There is a growing understanding that firms can avoid suffering disproportionate impacts from catastrophic events by taking a more analytical approach to mapping the aggregation risk within their portfolios. According to Validus chairman and CEO Ed Noonan, in statements following Tianjin last year, it is now “unacceptable” for the marine insurance industry not to seek to improve its modeling of risk in complex, ever-changing port environments. Women carrying sandbags to protect ancient ruins in Ayuttaya, Thailand during the seasonal monsoon flooding. While events such as the Tianjin port explosions, Thai floods and more recent Fort McMurray wildfires may have occurred in so-called industry “cold spots,” the impact of such events can be evaluated using deterministic scenarios to stress test a firm’s book of business. This can either provide a view of risk where there is a gap in probabilistic model coverage or supplement the view of risk from probabilistic models. Although much has been written about Nassim Taleb’s highly improbable “black swan” events, in a global and interconnected world firms’ increasingly must contend with the reality of “grey swan” and “white swan” events. According to risk consultant Geary Sikich in his article, “Are We Seeing the Emergence of More White Swan Events?” the definition of a grey swan is “a highly probable event with three principal characteristics: It is predictable; it carries an impact that can easily cascade…and, after the fact, we shift the focus to errors in judgment or some other human form of causation.” A white swan is a “highly certain event” with “an impact that can easily be estimated” where, once again, after the fact there is a shift to focus on “errors in judgment.” “Addressing unpredictability requires that we change how Enterprise Risk Management programs operate,” states Sikich. “Forecasts are often based on a “static” moment; frozen in time, so to speak…. Assumptions, on the other hand, depend on situational analysis and the ongoing tweaking via assessment of new information. An assumption can be changed and adjusted as new information becomes available.” “Best-in-class exposure management analytics is all about challenging assumptions and using disaster scenarios to test how your portfolio would respond if a major event were to occur in a non-modeled peril region.” It is clear Sikich’s observations on unpredictability are becoming the new normal in the industry. Firms are investing to fully entrench strong exposure management practices across their entire enterprise to protect against private catastrophes. They are also reaping other benefits from this type of investment: Sophisticated exposure management tools are not just designed to help firms better manage their risks and exposures, but also to identify new areas of opportunity. By gaining a deeper understanding of their global portfolio across all regions and perils, firms are able to make more informed strategic decisions when looking to grow their business. In specific regions for certain perils, firms’ can use exposure-based analytics to contextualize their modeled loss results. This allows them to “what if” on the range of possible deterministic losses so they can stress test their portfolio against historical benchmarks, look for sensitivities and properly set expectations. Exposure Management Analytics Best-in-class exposure management analytics is all about challenging assumptions and using disaster scenarios to test how your portfolio would respond if a major event were to occur in a non-modeled peril region. Such analytics can identify the pinch points – potential accumulations both within and across classes of business – that may exist while also offering valuable information on where to grow your business. Whether it is through M&A or organic growth, having a better grasp of exposure across your portfolio enables strategic decision-making and can add value to a book of business. The ability to analyze exposure across the entire organization and understand how it is likely to impact accumulations and loss potential is a powerful tool for today’s C-suite. Exposure management tools enable firms to understand the risk in their business today but also how changes can impact their portfolio – whether acquiring a book, moving into new territories or divesting a nonperforming book of business.


Accounting for Extra-Tropical Transitioning Typhoons in Japan
July 25, 2016RMS has invested considerable resources in developing an advanced approach to explicitly model transitioning typhoons in Japan, writes Margaret Joseph, Asia typhoon product manager. The pioneering work has helped to develop the most advanced Japan typhoon model on the market; one that makes allowances for the realistic patterns of typhoon wind and typhoon flood loss due to transitioning, which are a major driver of typhoon wind and flood damage in Japan. Not only have more than 50 percent of Japan’s landfalling typhoons either undergone or were undergoing extra-tropical transitioning, all Japan’s largest insured loss-causing typhoons had undergone or were undergoing extra-tropical transitioning when they made landfall. This includes Typhoon Mireille (1991), the costliest typhoon to strike Japan – and Asia as a whole. The importance of understanding and accurately modeling transitioning is, therefore, plainly crucial for catastrophe modelers and for those who use such models for business. Understanding the Phenomenon Japan’s geographical position, both its latitude and position under a strong jetstream, make it very susceptible to extra-tropical transitioning typhoons. A transitioning typhoon tends to be the strongest in terms of wind category at landfall, which has implications for a wind-loss perspective. Extra-tropical transitioning occurs when typhoons in the western North Pacific track toward the pole where they interact with mid-latitude weather systems and the jet stream. If the impact of the interaction is small, then they typically weaken, because of colder sea surface temperatures. If the impact is stronger, then they may change into a different kind of storm, which is initially a hybrid between a tropical cyclone and an extra-tropical cyclone, and which may ultimately end up as a pure extra-tropical cyclone. This transitioning can significantly alter the shape of the wind field, increasing the radius of maximum winds, shifting the location of the strongest winds and, at times, shifting the maximum winds from one side of the typhoon track to the other (Figure 1). Driven by the underlying changes in the wind field, extra-tropical transitioning impacts the storm surge and waves of a typhoon, also affecting the precipitation patterns within a typhoon. Figure 1. Satellite imagery of Typhoon Shanshan (2006). (a) On September 16 this tropical cyclone was located to the north of Taiwan and (b) three days later it tracked north near Japan and the Korean peninsula having undergone extra-tropical transitioning. The difference in the cloud patterns reflects the difference in the wind field prior to and after extra-tropical transitioning. (This is an example of a left-hand side/comma ETT cyclone.) (Source: Image taken from MODIS, NASA.) While several generations of RMS tropical cyclone models have included increasingly realistic representations of extra-tropical transitioning, we have recently concluded our largest body of research to better understand and model transitioning, focusing more specifically on typhoons in the western North Pacific. The peer-reviewed research has informed one of the numerous scientific advancements in the forthcoming RMS® Japan Typhoon HD Model. The rebuilt typhoon model now includes a novel parametric representation of the wind fields that replicates the features specific to extra-tropical transitioning, including accounting for classifications that have a higher probability of occurrence at a given time of year. Also, by being fully coupled, the model represents the impact of extra-tropical transitioning on precipitation, storm surge and wave through changes in the wind field. Figure 2. Examples of extra-tropical transitioning typhoons showing (a) the right-side wind field (e.g., Typhoon Halong, 2002), (b) the comma-shaped wind field with maximum winds to the LHS/RHS of the track (e.g., Typhoon Rammasun, 2008). (Source: RMS research.) While wind is a consideration, (re)-insurers must not ignore the flood component of typhoon risk when pricing the risk and modeling portfolio accumulations. Japan’s geographical position in relation to the “average” typhoon track, has implications for the flood hazard. As a typhoon tracks north, into the subtropics and mid-latitude, it can interact with other weather systems and transition to an extra-tropical cyclone. Storms that are transitioning or have transitioned when they impact Japan can bring more intense precipitation and/or storm surge. While Japan has one of the world’s most advanced flood protection systems, a significant proportion of the country lies below sea level. Consequently, if flood and coastal defenses are breached, widespread and severe flooding could ensue. Overall, typhoon presents both a significant risk as well as a growth opportunity for global (re)insurers. The RMS Japan Typhoon HD Model is designed to help users evaluate all these variables when considering their exposure to typhoon flood. RMS Research in This Area has Been Published in Scientific Journals Using a combination of observed data and numerical modeling studies, RMS modelers investigated the difference in the shape and extent of the wind field in extra-tropical transitioning typhoons as compared to the wind field in the tropical phase. Additionally, the RMS team classified different types of transitioning wind fields, with the important implication that in extra-tropical transitioning typhoons the maximum winds are not restricted to the right of the track. In fact, the maximum winds can be located on both sides of the typhoon track; for one type of RMS-classified transitioning the maximum winds can flip across the typhoon track. The research builds on work from Naoko Kitabatake at the Meteorological Research Institute in Japan, involved work with Professor David Nolan of the University of Miami, and has been reviewed by Professor John Knaff of NOAA/NESDIS/STAR – RAMMB CIRA at Colorado State University and Professor Yukio Tamura of the Wind Engineering Research Center in Tokyo. Loridan, T., Khare, S., Scherer, E., Dixon, M., & Bellone, E. (2015). Parametric modeling of transitioning cyclone wind fields for risk assessment studies in the western North Pacific. Journal of Applied Meteorology Climatology, 54, 624–642. doi:http://dx.doi.org/10.1175/JAMC-D-14-0095.1 Loridan, T., Scherer, E., Dixon, M., Bellone, E., & Khare, S. (2014). Cyclone wind field asymmetries during extratropical transition in the western North Pacific. Journal of Applied Meteorology Climatology 53, 421–428. doi:http://dx.doi.org/10.1175/JAMC-D-13-0257.1 Margaret Joseph is a product manager for RMS Asia Pacific tropical cyclone models, including Australia cyclone, China typhoon, and the forthcoming western North Pacific typhoon model.


Spatial Correlation - Risk and Opportunity
July 25, 2016According to Maurizio Savina and Adrian Mark, flood risk experts at RMS, as much as 80 percent of 1-in-200 year European flood losses that impact the (re)insurance industry result from Pan-European events. Understanding the “spatial correlation” of countries more prone to simultaneous flooding is, therefore, essential in managing accumulations and identifying opportunities to diversify the risk in a portfolio. In June 2016, the severe floods that affected several European countries are expected to generate claims of up to $1.6 billion for the French market and around $1.4 billion for Germany. This follows Germany’s record year for flood losses in 2013, and a year when total economic losses for flood reached $16.5 billion across central and eastern Europe, of which $4.1 billion was insured. Those flood events demonstrate how multiple river systems can be affected, impacting more than one country, and lasting for several days or even weeks depending on regional meteo-hydrological conditions. The underlying driver of such broad flooding is often just a single weather system that produces heavy precipitation over multiple countries. “SOME NEIGHBORING COUNTRIES SHARING COMMON RIVER BASINS ARE MORE LIKELY TO BE IMPACTED AT THE SAME TIME BY A MAJOR FLOOD.” In fact, a quarter of major European flood events impact more than one country. And floods simultaneously affecting at least three European countries account for more than 90 percent of tail risk across Europe. These facts underscore the importance of understanding the correlation and diversification of risk across both basins and countries in order to accurately estimate portfolio accumulations and capital requirements. Figure 1. Spatial correlation of flood risk between London and other locations in Europe. (Source: RMS Europe Flood HD Models.) To further emphasize the point, RMS estimates that approximately 20 percent of the 1-in-200 year losses arising from portfolios in Germany and the Czech Republic are from events that impact both countries at the same time. This is a statistically significant level of spatial correlation, and a consideration for (re)insurers when managing their international portfolios. Compared to Germany and the Czech Republic, for other territories spatial correlation can be significantly lower, offering (re)insurers opportunities to diversify their flood risk. Figure 1 shows the spatial correlation of flood risk between London and all other parts of Europe. The red territories are highly correlated with London and thus more likely to be hit by common events, with yellow-to-green areas not correlated with London and southern England. By using this information a (re)insurer with a portfolio concentrated in southern England could strategically target expansion into central or eastern Europe in order to grow its portfolio while minimizing accumulations of correlated risk. Closing the Protection Gap The gap between economic losses and insured loss for flood events is a global issue. Each new major flood event further stresses the need for greater insurance penetration around the world. Europe is not immune from the issue. In markets where flood insurance is not bundled into standard insurance policies, such as in Germany, adoption of flood cover is relatively low in comparison to markets like France, Spain and the U.K. While uptake increased marginally in the aftermath of the 2013 floods, there remains a significant opportunity to close the protection gap and improve the country’s flood resilience – with models playing a key role. “A BIGGER GAP BETWEEN ECONOMIC AND INSURED LOSSES FROM THE JUNE 2016 FLOODS IS EXPECTED IN GERMANY THAN IN FRANCE DUE TO LOWER LEVELS OF FLOOD INSURANCE PENETRATION.” The success of “nat cat” schemes in these markets is one mechanism with which the industry can assist governments to close the protection gap. The U.K.’s Flood Re initiative is one example of a public-private approach whose aim is to ensure residential properties at a high risk of flood have access to affordable insurance, while lobbying for increased physical resilience through continued investment in flood defenses and mitigation measures. Catastrophe modeling is essential to the future success of such schemes and to increasing Europe’s flood resilience more generally. Risk transfer and risk mitigation require high-precision modeling across Europe to better understand the impact of Pan-European flooding. But these tools can also be used to understand the importance of investment in flood defenses and inform planning guidelines in flood-prone areas. Managing Flood Accumulations RMS Europe Inland Flood High Definition (HD) Models were developed to help the insurance industry and policymakers better evaluate the potential impact of Europe’s flood events through an improved understanding of risk accumulations, ensuring a major event does not have a disproportionate impact on a (re)insurer’s portfolio. These models simulate hydrology continuously in space and time to reproduce both temporal and spatial correlation of flood risk and offer the largest single Europe-wide event set available on the market, covering 18 river basins and 8,289 catchments over 13 countries. Maurizio Savina is a senior product manager for the RMS Europe flood models. Adrian Mark is senior product manager for RMS flood maps and data.


The Next Step in Convergence
July 25, 2016EXPOSURE investigates how traditional reinsurers, recognizing that third-party capital provides an opportunity rather than a threat, are opting to build or buy their own insurance-linked securities (ILS) fund management capabilities. The property catastrophe reinsurance industry has undergone a rapid transformation over the past decade as capital from institutional investors has flooded into the sector. Attracted by solid returns and an asset class that is uncorrelated to their other investments, investors steadily increased their allocations to ILS. At the same time as the resulting demand for product has intensified, collateralized reinsurance has overtaken catastrophe bonds as the dominant source of ILS capacity. As this institutional capital flooded into the peak zones of Florida wind, California earthquake and Japanese wind and earthquake, traditional reinsurers initially felt displaced. Excess capital, several years of benign catastrophe losses and differing risk and return appetites among the so-called “alternative” capital has heightened competition and eroded rates-on-line. 2015 saw a 3.5 percent reduction in traditional capital dedicated to reinsurance, down US$13 billion to US$357 billion according to Willis Re, reflecting the challenging operating environment and record volume of M&A activity among other drivers. The reduction was offset by the continued growth in non-traditional capital, which hit new heights of US$70 billion. Opportunity or Threat? Capital Growth for Dedicated ILS Funds and Reinsurer Third-Party Capital Managers More progressive reinsurance companies recognize this non-traditional capital is here to stay and the opportunities it presents if properly harnessed. While dedicated ILS funds still dominate the market in terms of assets under management, in recent years more reinsurers have sought to leverage these opportunities, setting up their own dedicated ILS funds, sidecars or special purpose syndicates to offer cedants a broader array of risk transfer tools while tapping third-party capital. Aspen, Everest Re, Hannover Re and Munich Re were among those who significantly increased sidecar capital earlier in 2016; there was also marked growth in managed fund capacity by Hiscox (Kiskadee Re), Validus Re (AlphaCat) and Lancashire (Kinesis) among others. Some have sought to access third-party capital by investing in existing players, with Leadenhall’s increased stake in Amlin, Markel’s acquisition of CATCo and Endurance’s acquisition of Blue Capital (as part of its acquisition of Montpelier Re), as recent examples. Managed fund capacity arguably combines the best underwriting with the most efficient forms of capital in the markets where it is deployed. The collateralized reinsurance platforms have access to the track record, underwriting expertise and catastrophe modeling and analytics know-how of the parent company, while the parent company gains access to considerable capital not held within its own balance sheet. Reinsurers are also able to target different business through their third-party management capabilities. Generally, pure ILS funds prefer “cleaner”, modelable business, whereas a traditional reinsurance company has access to the whole market. However, a reinsurer-owned fund is able to leverage the parent company’s existing infrastructure, access to business and its suite of risk management and pricing tools in order to offer something that is different from some of the independent ILS funds. Third-Party Reinsurance Capital Volume ($B) This is attractive to investors, particularly those looking to diversify away from property catastrophe peak perils into other classes of business. One trend for the collateralized reinsurance market is its growth outwards, both by territory and line of business. The ability to apply catastrophe models and exposure management tools in this bid for diversification is becoming a key differentiator for ILS funds. “THE ABILITY TO APPLY CATASTROPHE MODELS AND EXPOSURE MANAGEMENT TOOLS IN THIS BID FOR DIVERSIFICATION IS BECOMING A KEY DIFFERENTIATOR FOR ILS FUNDS.” Lancashire’s Kinesis Capital, for instance, has been set up as a multi-class, fully collateralized reinsurance provider covering specialty classes such as marine among its product offerings, albeit backed by a strong analytical approach. And the trend looks set to continue. In April 2016, ILS publication Artemis noted that the launch of the RMS® Marine Cargo and Specie catastrophe risk model would provide an enhanced approach to marine risk quantification, helping ILS investors and capital to increase participation in the marine insurance and reinsurance market. There are signs that some of the independent funds are recognizing the great benefit of having in-house catastrophe modeling and analytics capabilities, opting to license reinsurance catastrophe models or hire reinsurance talent from markets such as Lloyd’s and Bermuda to bolster their offerings. The boundary between the traditional reinsurance market and ILS arena will continue to blur in the coming years as market players seek to combine the best underwriting – and modeling and analytics expertise – with the most efficient form of capital.


U.S. Coastal Flood - Rising Up the Agenda
July 25, 2016At a time when the U.S. property catastrophe sector is experiencing heightened competition, flood insurance offers untapped potential that can benefit (re)insurers, the government and emergency management organizations, explains RMS flood risk expert Jeff Waters. Opportunities begin at the coast, where storm surge-driven coastal flooding stimulates the majority of the flood risk profile. Using a variety of newly available flood tools, probabilistic models and location-level analytics, private carriers can quantify coastal flood risk accurately, allowing them to determine the size and extent of opportunities and where to capitalize on them. Coastal flood is a unique peril due to its complex hydrodynamic characteristics and highly granular gradients. The magnitude and severity of U.S. coastal flood risk is dependent on a number of factors, including the shape of the coastline, local bathymetric and topographic profiles, slope and elevation. From a (re)insurer’s perspective, it’s also highly dependent on building characteristics, such as first-floor elevation or presence of flood defenses, as well as flood coverage conditions and exclusions. In the U.S., the majority of the coastal flood risk profile is driven by storm surge from tropical cyclone events. Consequently, the most susceptible areas are located along the Gulf Coast and Eastern Seaboard, where exposures are high and distance to the coast is low. According to RMS research, there is more than $11 trillion in exposure in coastal ZIP codes from Texas to Maine, especially in the last 10-15 years. In 2005, Hurricane Katrina caused $15 billion in economic storm surge losses in Orleans Parish alone, which includes the city of New Orleans. It was the first time in decades that over 50 percent of losses from a hurricane were driven by storm surge. Levee and flood wall failures caused flooding across 80 percent of New Orleans, devastating much of the city and costing the insurance industry $41 billion (at 2005 prices) in catastrophe claims. “ACCORDING TO RMS RESEARCH THERE IS MORE THAN $11 TRILLION IN EXPOSURE IN COASTAL ZIP CODES FROM TEXAS TO MAINE.” Storm surge was once again a major driver of loss during Superstorm Sandy in 2012. The pulse of seawater pushed ashore by the storm’s hurricane-force winds flooded streets, tunnels and subway lines in New York City and surrounding areas, causing insured losses of nearly $19 billion, 60 percent of which was attributed to coastal flooding. Surge risk is only going to increase in the future. Risk and corresponding losses from hurricane-induced storm surge are expected to grow as a result of sea-level rise and increasing coastal exposures. In 2014, RMS partnered with the Risky Business Initiative to quantify and publicize the economic risks of climate change in the U.S. Among other findings, the study determined that by mid-century, storm surge has the potential to generate more than half of economic losses from landfalling hurricanes in the U.S. The U.S. Flood Opportunity – It Starts on the Coast The movement towards privatizing the U.S. flood insurance market reflects concern surrounding the flood “protection gap” and the unsustainability of the National Flood Insurance Program (NFIP), which has amassed more than $23 billion in debt by offering coverage at rates that do not reflect the true underlying risk. This is especially true in highly exposed coastal zones, where it is estimated that as much as 20 percent of NFIP flood insurance rates are subsidized. Unlocking the potential for flood privatization nationwide will depend on a number of factors, from federal and state-level legislative reform to the implementation of more actuarially sound rates. It may take years before the private flood market is mature, but the foundation is taking shape and opportunities are materializing. Figure 1. Current and projected 100-year return period economic storm surge losses. (Source: RMS) In the meantime, it is important to recognize where private carriers can begin to assess and capitalize on these opportunities today – the hurricane coast. Here, where many FEMA high-risk flood zones (A and V) are located, NFIP participation ranges from 10 percent to 70 percent, according to RMS. It is also an area for which model vendors have developed a number of advanced flood analytics, from probabilistic models to hazard data, both of which provide a more comprehensive view of the coastal flood risk landscape and enable private carriers to quantify coastal flood risk more accurately. Probabilistic storm surge models are widely available in the market today. Often integrated with a broader hurricane or wind model solution, they provide frequency, severity and uncertainty metrics for a spectrum of potential coastal flood events, helping to inform more accurate portfolio management, reinsurance pricing and risk transfer decisions. Flood hazard metrics, on the other hand, are newer to the market. They provide varying views of flood extent and severity throughout the U.S., depending on the provider. In many cases they represent hazard on a more granular basis than is currently possible using FEMA maps, enabling carriers to differentiate risks within flood zones with more precision and accuracy, and determine where FEMA may be over- or underestimating flood hazard in a given location to, ultimately, select (or avoid) the risk vis-à-vis the NFIP. For example, the recently released RMS U.S. Flood Hazard Data provides defended and undefended views of flood hazard extent and severity for multiple return periods, reflecting all sources of both coastal and inland flooding. As the private flood insurance market continues to take shape, enhanced flood analytics can be used to gain important insights into potential flood events before they occur, particularly along the coast, allowing (re)insurers to be more proactive than reactive when developing, managing and growing a profitable flood portfolio. Success will, however, depend largely on the ability of the market to quantify flood risk with sufficient granularity and to offer actuarially sound rates that allow (re)insurers to obtain a profitable return. Advice to (Re)insurers Looking to Grow a Coastal Flood Portfolio Collect high-quality, flood-relevant exposure data. Knowing precise location and elevation information, such as distance to coast and the presence of local flood defenses, is just as important as knowing the structural profile. Having important elevation information, such as the height of the lowest occupied floor or the threshold flood height, helps determine the approximate water level needed to cause damage to the property. Understand the correlation between surge and other types of coastal hazards, and how it translates to policy terms and conditions. Hurricane wind and surge impacts are often correlated; knowing where and to what extent can help you avoid overconcentration of risk. Tropical cyclone-induced precipitation can also drive a significant amount of damages along the coast. Know the potential future impacts of large-scale climate and exposure patterns. By mid-century, storm surge is expected to generate more than half of the economic losses coming from landfalling U.S. hurricanes. With sea-level rise comes an increased likelihood for catastrophic surge events, especially in coastal cities with shallow sloping coastal profiles (Tampa, FL). Jeff Waters is responsible for guiding the insurance market’s understanding and usage of RMS North America climate models, including the hurricane, severe convective storm and winter storm models.
