


EXPOSURE
The RMS Magazine with a unique perspective and clear mission “... to provide insight and analysis to help insurance and risk professionals innovate, adapt, and deliver.”
Insurance: The next 10 years
Mohsen Rahnama, Cihan Biyikoglu and Moe Khosravy of RMS look to 2029, consider the…
Times Square, New York City
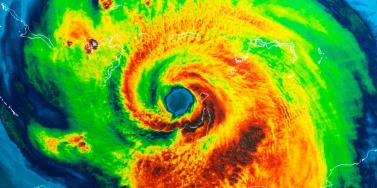
Tag: Tohuku Earthquake
The Earthquakes That Changed Everything
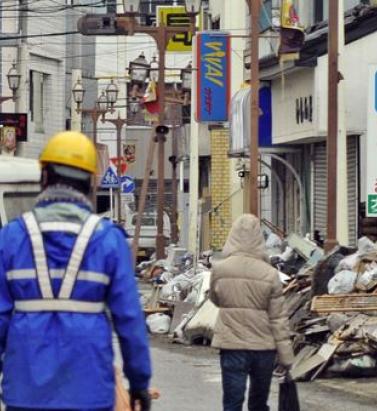
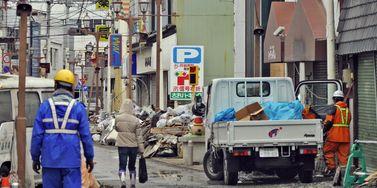
June 15, 2021In the decade since the devastating 2011 Tohoku and Christchurch Earthquakes, risk modelers such as RMS have been proactive in honoring the data generated from these events. It is a process of continuous learning and refinement, explains Chesley Williams and Laura Barksby from RMS, and the journey is still ongoing Within the space of just 17 days in 2011, Christchurch in New Zealand was rocked by an M6.3 earthquake — almost directly beneath the central business district (CBD) — and Japan was reeling from the most powerful earthquake in its history. At RMS, event response and reconnaissance teams were mobilized with the implicit knowledge they were there to do justice to those affected and to gather as much data as possible in order to advance seismic hazard and risk understanding. The tsunami waves triggered by the M9.0 Tohoku Earthquake inundated approximately 532 square kilometers (205 square miles) of the country's northeastern coastline. At its highest point, the waves reached over 15 meters (49 feet) in some localized areas. They overtopped seawalls, destroyed 122,000 buildings with over a million buildings severely or partially damaged, and damaged 230,000 vehicles. The event also triggered level seven meltdowns at Fukushima Dai-ichi Nuclear Power Station. The disaster at Chernobyl in 1986 was the only previous level seven event. The catastrophe was watched, in horror, in real time on news channels around the world. In total, it caused 15,899 deaths with 2,527 missing. Estimated economic damage totaled US$235 billion. When initiating a risk model update, cat modelers generally start with published national seismic hazard maps, which are typically built on consensus-based research. This represents an important first step — to review the key assumptions in such studies to make sure that they are consistent with the latest data and methods for seismic hazard and risk assessment. “When we developed our RMS® Japan Earthquake Model in 2005, the starting point was the first version of the national seismic hazard maps released in that year,” says Chesley Williams, senior director at RMS. “We had detailed discussions with the Japanese researchers who developed the maps to understand the key assumptions, particularly with a focus on the sources impacting Tokyo.” After the 2011 event, it is now clear that the Japan Trench can produce M9 events. The 2005 national hazard maps were focused on the M7-M8 events that had occurred in the preceding 450+ years. Looking at the geologic record that there have likely been large, possibly M9 events in the past, for example the Jogan Sanriku Earthquake in 869. Honoring the Data So much about both these events in 2011 — the Christchurch Earthquake on February 22 and Tohoku Earthquake on March 11 — was unexpected. Although New Zealand is a highly seismic region, the 2010-11 Canterbury Earthquake Sequence occurred in an area that historically had relatively low seismicity. Prior to the Canterbury Earthquake Sequence there were fewer than 30 earthquakes of magnitude four or greater in Christchurch and the immediate surrounding area. In the last decade, there have been more than 370 earthquakes in this region. The Christchurch Earthquake caused higher-than-expected ground motions and unprecedented liquefaction. As a result, it was the costliest event in the sequence and the second-highest insured loss from earthquake in history, after the Tohoku Earthquake. Japan is also highly seismic, but the Tohoku event occurred on structures that had not shown their full potential during the historical record. The intensity of M9.0 Tohoku was particularly surprising in scale — the highest-ever economic losses from a natural disaster — and the tsunami impact was unprecedented for Japan. “Both Christchurch and Tohoku taught us an awful lot about earthquake risk, including the secondary impacts of earthquakes — tsunami, liquefaction, landslides, nuclear disaster, aftershocks, business interruption, contingent business interruption, and post-event loss amplification,” commented Williams. “They transformed how we think about and model seismic hazard and risk.” New Insights Into Large-Magnitude Events Media coverage of Tohoku clearly showed that the damage in the tsunami induction zones was catastrophic. Once the search and rescue work had been completed, RMS sent a reconnaissance team to Japan to examine tsunami damage and also damage from strong ground shaking, which was extensive. Key observations from this work included that older (pre-1981) concrete buildings often sustained significant damage at high ground motions, traditional wooden homes with heavy tile roofs were more heavily damaged than more modern home construction, and contents damage in high-tech industrial facilities was particularly problematic for production continuity. Tsunami damage from the Tohoku EarthquakeIn the period immediately following a disaster, the Japanese government posts running tallies for the damage statistics as they are collected. This data is invaluable for understanding the scale of damage but also provides important insights with regard to drivers of loss. RMS used these damage statistics during the early event response process to help inform economic and insured loss estimates. In subsequent months, more comprehensive damage statistics compiled by Japan’s Ministry of Land, Infrastructure, Transport and Tourism proved vital for refinement of building performance modeling by RMS during strong ground shaking as well as for the development of vulnerability functions for tsunami inundation. Japan has created and maintained what is arguably the best and most dense national seismic network in the world. This network recorded more than 1,000 observations of the ground motions produced by the Tohoku Earthquake. Because large M9+ events are so rare (only five in the last 150 years), this observation dataset is key for understanding the strong ground motions produced by these extremely strong earthquakes. “Prior to this event, modeling of ground motions for events in this magnitude range had to be extrapolated from observation of smaller magnitude events,” says Williams. “Having more data to constrain M9+ ground motions helps refine seismic hazard and risk for all regions that can experience events in this magnitude range. Additionally, the observation data captured the details of the interaction of sedimentary basins and shallow site conditions on ground motion amplitude and frequency content.” The information has allowed RMS to dramatically improve the assessment of site condition impacts (both shallow and deep) to allow for a better assessment of localized interactions of ground motions on structural performance. Following the 2011 events, the Japanese government commissioned a series of comprehensive research studies to better understand earthquake potential for the key subduction zones (i.e., Japan Trench, Kuril Trench, Sagami Trough and Nankai Trough) and key crustal faults. The goal was to extend understanding of the historical record by utilizing the geologic record and providing information on past events over the last several thousand years. Key geologic datasets that were examined included paleotsunami deposits in coastal regions, coastal terraces uplifted in past events and paleoseismic studies to examine past ruptures on faults. The RMS Japan Earthquake Model was informed by all these datasets, allowing for a better representation of the range of events that can occur as well as better constraining the recurrence of future events on these structures. Advances in Tsunami Modeling Prior to the Tohoku event, RMS tsunami solutions had been focused on key tsunami scenario footprints that were developed to allow for an understanding of exposure accumulations at risk. “With the 2011 event and the contribution of approximately 30 percent of the loss from tsunami, it was clear that RMS needed to start providing fully probabilistic tsunami solutions,” said Williams. “The unique characteristics of the Tohoku tsunami event and its generation were key for guiding the RMS tsunami hazard and risk development.” The extremely high fault slip and large ocean bottom deformations highlighted the importance of modeling a range of slip models. RMS has chosen to use analytical slip modeling, and the sampling of alternative slip models for a given earthquake rupture allows for a more comprehensive understanding of tsunami and seismic risk. Tsunami insights from Tohoku also informed tsunami modeling in New Zealand. Following Tohoku, GNS Science, the New Zealand geoscience research institute, updated the maximum magnitude potential for the Hikurangi Subduction Zone to the east of the North Island. This assumption is reflected in the RMS® New Zealand Earthquake HD Model, and when combined with other updates, the larger magnitude has consequential impacts for portfolios with exposure in the capital of Wellington. Lessons in Liquefaction Residents in Christchurch had certainly felt the initial M7.1 Darfield Earthquake on September 4, 2010, some 40 kilometers (25 miles) west of the city, and power and water supplies were disrupted. The event caused moderate damage, the worst of which was to unreinforced masonry chimneys and walls. Damage was also observed in historic buildings. Following the Darfield event, assessments were made to repair the damaged buildings. However, despite the lower magnitude of the February 2011 earthquake, its proximity almost directly beneath the CBD meant that the ground motions were considerable. The Christchurch Earthquake generated widespread liquefaction and was part of an ongoing sequence of events, the largest of which, following February 2011, were M5.9, M5.5 and M5.3. A number of buildings that had been compromised during the September 2010 quake crumbled under the more intense ground motion of February 22, 2011. “It was the way the sequence moved eastward from Darfield to Christchurch so that it was virtually under the CBD that made it so devastating," said Laura Barksby, product manager at RMS. "It occurred in the wrong place at the wrong time.” The Christchurch event exacerbated preexisting damage, as well as damaging previously unscathed structures. Damage was so severe in some areas of Christchurch that a red zone was established, within which it was considered uneconomical to repair buildings, and structures were demolished regardless of their state. In total, the Canterbury Earthquake Sequence caused 185 fatalities and around NZ$40 billion in economic damage, of which an estimated NZ$33-38 billion was insured. The sudden change in seismicity was traumatic for residents and hampered efforts to assess the damage and begin the rebuild and restoration process. Access inside the CBD was restricted as many older structures, mostly unreinforced masonry buildings, were deemed unsafe. In the years immediately following the earthquake, demolitions outnumbered rebuilds by four to one. Aftermath of the Christchurch Earthquake in 2011“There has been a huge societal impact. The CBD was cordoned off and many businesses had to close,” says Barksby. “From a community perspective, they went from years of no earthquakes to almost waiting for the next to happen. The fact that the events were part of a sequence added to that sense of nervousness.” The overall headline, she explains, was the damage caused by liquefaction. “When we think about earthquakes, our immediate thoughts are about the ground shaking, but with Christchurch the focus was the liquefaction. It was responsible for around 30 to 40 percent of the losses, which is considerable.” During an earthquake, the ground motions can cause an increase in water pressure in soil layers beneath the ground. This can cause a reduction in the strength of the soil particles, and they subsequently behave like a liquid, which can cause significant ground deformation. In Christchurch, for buildings with shallow foundations, there was significant damage. One aspect that had not been appreciated prior to Christchurch was the scale of the destruction liquefaction could cause — and the loss it could generate. RMS reconnaissance observed that some buildings experienced no shake damage but considerable liquefaction damage. “The damage was particularly bad along the River Avon in Christchurch," says Barksby. "Due to the lateral displacement, it looked as though some of the buildings had been pulled apart — the Christchurch Earthquake really demonstrated the different types of liquefaction displacement.” This represented an important distinguishing feature when modeling liquefaction risk. “What was seen in Christchurch was a notable difference in the damage severity depending on the liquefaction process that had occurred. There was a correlation between the type of liquefaction displacement and building damage,” said Barksby. “Lateral spreading versus vertical displacement can have very different outcomes when it comes to loss. This distinction is not something we were able to capture before Christchurch, but thanks to data we can now model it at a high resolution and directly relate it to damage at a location.” The liquefaction impact was highly variable, a feature best captured by aerial photographs taken in the immediate aftermath. While some streets were largely unscathed, others looked as though they had been inundated by flood waters from liquefaction expressed at the surface. Barksby added, “We also saw streets with the whole spectrum of liquefaction damage, ranging from none at all to severe damage just a few hundred meters down the road.” Geotechnical engineering experts from around the world seized the opportunity to better understand the hazard, using Christchurch as a liquefaction laboratory. Through its collaboration with the Canterbury Geotechnical Database (now known as the New Zealand Geotechnical Database), RMS was able to analyze borehole data along with claims insights in order to better understand how soil characteristics, water table depth and proximity to water courses influenced the exposure. It was also really important to establish the link on how liquefaction translated into damage, as ultimately this was the main area of concern. Given the significant advances in seismic understanding after Christchurch, New Zealand was chosen as the location for the first RMS high-definition (HD) earthquake model. Released in 2016 and updated in 2020, the model leveraged the surge in data available from the Earthquake Commission (EQC) and GNS Science, among others, together with collaboration partners in the insurance market to offer a more granular view of the hazard and vulnerability. The RMS New Zealand Earthquake HD Model was also the first to include an advanced liquefaction module in addition to landslide, fire following earthquake and probabilistic tsunami. ʺWe applied all the lessons from Christchurch to the rest of the country at a more localized level than had been possible before,” says Barksby. “New Zealand was selected for the first high-definition model because we had so much data arising from the sequence that we knew we could leverage HD methodologies and Cloud-computing technology, plus the country has a sophisticated insurance market.” Barksby describes it as a paradigm shift, with the same underlying principles and framework rolled out to improve the granularity and level of hazard and vulnerability detail captured by the other earthquake models, including those for Japan and North America. Striving for a Resilient Future A decade on from Tohoku and Christchurch, communities in Japan and New Zealand are still coming to terms with the tragedies and how the quakes have shaped their lives. While very large earthquakes remain relatively rare, it is important to understand the potential, including from the associated perils. The return period for earthquakes on major faults or subduction zones is hundreds to thousands of years. Because they are so rare, each earthquake disaster has its own unique characteristics. The events of 2011 were an opportunity to learn and to continue to push the boundaries of earthquake science and seismic engineering. The earthquakes provided a unique opportunity to fundamentally improve the scientific and engineering communities’ understanding of earthquakes and their impacts. RMS has used this opportunity to redefine its perspective on seismic risk in Japan and in New Zealand, and beyond. Chesley Williams concludes: “At RMS, the goal is to implement the best available science, to understand the limitations of the modeling, to apply appropriate uncertainty assumptions and to ensure that we make the best estimate of seismic risk based on the information we have today.”
Living in a World of Constant Catastrophes
May 20, 2019(Re)insurance companies are waking up to the reality that we are in a riskier world and the prospect of ‘constant catastrophes’ has arrived, with climate change a significant driver In his hotly anticipated annual letter to shareholders in February 2019, Warren Buffett, the CEO of Berkshire Hathaway and acclaimed “Oracle of Omaha,” warned about the prospect of “The Big One” — a major hurricane, earthquake or cyberattack that he predicted would “dwarf Hurricanes Katrina and Michael.” He warned that “when such a mega-catastrophe strikes, we will get our share of the losses and they will be big — very big.” The use of new technology, data and analytics will help us prepare for unpredicted ‘black swan’ events and minimize the catastrophic losses Mohsen Rahnama RMS The question insurance and reinsurance companies need to ask themselves is whether they are prepared for the potential of an intense U.S. landfalling hurricane, a Tōhoku-size earthquake event and a major cyber incident if these types of combined losses hit their portfolio each and every year, says Mohsen Rahnama, chief risk modeling officer at RMS. “We are living in a world of constant catastrophes,” he says. “The risk is changing, and carriers need to make an educated decision about managing the risk. “So how are (re)insurers going to respond to that? The broader perspective should be on managing and diversifying the risk in order to balance your portfolio and survive major claims each year,” he continues. “Technology, data and models can help balance a complex global portfolio across all perils while also finding the areas of opportunity.” A Barrage of Weather Extremes How often, for instance, should insurers and reinsurers expect an extreme weather loss year like 2017 or 2018? The combined insurance losses from natural disasters in 2017 and 2018 according to Swiss Re sigma were US$219 billion, which is the highest-ever total over a two-year period. Hurricanes Harvey, Irma and Maria delivered the costliest hurricane loss for one hurricane season in 2017. Contributing to the total annual insurance loss in 2018 was a combination of natural hazard extremes, including Hurricanes Michael and Florence, Typhoons Jebi, Trami and Mangkhut, as well as heatwaves, droughts, wildfires, floods and convective storms. While it is no surprise that weather extremes like hurricanes and floods occur every year, (re)insurers must remain diligent about how such risks are changing with respect to their unique portfolios. Looking at the trend in U.S. insured losses from 1980–2018, the data clearly shows losses are increasing every year, with climate-related losses being the primary drivers of loss, especially in the last four decades (even allowing for the fact that the completeness of the loss data over the years has improved). Measuring Climate Change With many non-life insurers and reinsurers feeling bombarded by the aggregate losses hitting their portfolios each year, insurance and reinsurance companies have started looking more closely at the impact that climate change is having on their books of business, as the costs associated with weather-related disasters increase. The ability to quantify the impact of climate change risk has improved considerably, both at a macro level and through attribution research, which considers the impact of climate change on the likelihood of individual events. The application of this research will help (re)insurers reserve appropriately and gain more insight as they build diversified books of business. Take Hurricane Harvey as an example. Two independent attribution studies agree that the anthropogenic warming of Earth’s atmosphere made a substantial difference to the storm’s record-breaking rainfall, which inundated Houston, Texas, in August 2017, leading to unprecedented flooding. In a warmer climate, such storms may hold more water volume and move more slowly, both of which lead to heavier rainfall accumulations over land. Attribution studies can also be used to predict the impact of climate change on the return-period of such an event, explains Pete Dailey, vice president of model development at RMS. “You can look at a catastrophic event, like Hurricane Harvey, and estimate its likelihood of recurring from either a hazard or loss point of view. For example, we might estimate that an event like Harvey would recur on average say once every 250 years, but in today’s climate, given the influence of climate change on tropical precipitation and slower moving storms, its likelihood has increased to say a 1-in-100-year event,” he explains. We can observe an incremental rise in sea level annually — it’s something that is happening right in front of our eyes Pete Dailey RMS “This would mean the annual probability of a storm like Harvey recurring has increased more than twofold from 0.4 percent to 1 percent, which to an insurer can have a dramatic effect on their risk management strategy.” Climate change studies can help carriers understand its impact on the frequency and severity of various perils and throw light on correlations between perils and/or regions, explains Dailey. “For a global (re)insurance company with a book of business spanning diverse perils and regions, they want to get a handle on the overall effect of climate change, but they must also pay close attention to the potential impact on correlated events. “For instance, consider the well-known correlation between the hurricane season in the North Atlantic and North Pacific,” he continues. “Active Atlantic seasons are associated with quieter Pacific seasons and vice versa. So, as climate change affects an individual peril, is it also having an impact on activity levels for another peril? Maybe in the same direction or in the opposite direction?” Understanding these “teleconnections” is just as important to an insurer as the more direct relationship of climate to hurricane activity in general, thinks Dailey. “Even though it’s hard to attribute the impact of climate change to a particular location, if we look at the impact on a large book of business, that’s actually easier to do in a scientifically credible way,” he adds. “We can quantify that and put uncertainty around that quantification, thus allowing our clients to develop a robust and objective view of those factors as a part of a holistic risk management approach.” Of course, the influence of climate change is easier to understand and measure for some perils than others. “For example, we can observe an incremental rise in sea level annually — it’s something that is happening right in front of our eyes,” says Dailey. “So, sea-level rise is very tangible in that we can observe the change year over year. And we can also quantify how the rise of sea levels is accelerating over time and then combine that with our hurricane model, measuring the impact of sea-level rise on the risk of coastal storm surge, for instance.” Each peril has a unique risk signature with respect to climate change, explains Dailey. “When it comes to a peril like severe convective storms — tornadoes and hail storms for instance — they are so localized that it’s difficult to attribute climate change to the future likelihood of such an event. But for wildfire risk, there’s high correlation with climate change because the fuel for wildfires is dry vegetation, which in turn is highly influenced by the precipitation cycle.” Satellite data from 1993 through to the present shows there is an upward trend in the rate of sea-level rise, for instance, with the current rate of change averaging about 3.2 millimeters per year. Sea-level rise, combined with increasing exposures at risk near the coastline, means that storm surge losses are likely to increase as sea levels rise more quickly. “In 2010, we estimated the amount of exposure within 1 meter above the sea level, which was US$1 trillion, including power plants, ports, airports and so forth,” says Rahnama. “Ten years later, the exact same exposure was US$2 trillion. This dramatic exposure change reflects the fact that every centimeter of sea-level rise is subjected to a US$2 billion loss due to coastal flooding and storm surge as a result of even small hurricanes. “And it’s not only the climate that is changing,” he adds. “It’s the fact that so much building is taking place along the high-risk coastline. As a result of that, we have created a built-up environment that is actually exposed to much of the risk.” Rahnama highlighted that because of an increase in the frequency and severity of events, it is essential to implement prevention measures by promoting mitigation credits to minimize the risk. He says: “How can the market respond to the significant losses year after year. It is essential to think holistically to manage and transfer the risk to the insurance chain from primary to reinsurance, capital market, ILS, etc.,” he continues. “The art of risk management, lessons learned from past events and use of new technology, data and analytics will help to prepare for responding to unpredicted ‘black swan’ type of events and being able to survive and minimize the catastrophic losses.” Strategically, risk carriers need to understand the influence of climate change whether they are global reinsurers or local primary insurers, particularly as they seek to grow their business and plan for the future. Mergers and acquisitions and/or organic growth into new regions and perils will require an understanding of the risks they are taking on and how these perils might evolve in the future. There is potential for catastrophe models to be used on both sides of the balance sheet as the influence of climate change grows. Dailey points out that many insurance and reinsurance companies invest heavily in real estate assets. “You still need to account for the risk of climate change on the portfolio, whether you’re insuring properties or whether you actually own them, there’s no real difference.” In fact, asset managers are more inclined to a longer-term view of risk when real estate is part of a long-term investment strategy. Here, climate change is becoming a critical part of that strategy. “What we have found is that often the team that handles asset management within a (re)insurance company is an entirely different team to the one that handles catastrophe modeling,” he continues. “But the same modeling tools that we develop at RMS can be applied to both of these problems of managing risk at the enterprise level. “In some cases, a primary insurer may have a one-to-three-year plan, while a major reinsurer may have a five-to-10-year view because they’re looking at a longer risk horizon,” he adds. “Every time I go to speak to a client — whether it be about our U.S. Inland Flood HD Model or our North America Hurricane Models — the question of climate change inevitably comes up. So, it’s become apparent this is no longer an academic question, it’s actually playing into critical business decisions on a daily basis.” Preparing for a Low-carbon Economy Regulation also has an important role in pushing both (re)insurers and large corporates to map and report on the likely impact of climate change on their business, as well as explain what steps they have taken to become more resilient. In the U.K., the Prudential Regulation Authority (PRA) and Bank of England have set out their expectations regarding firms’ approaches to managing the financial risks from climate change. Meanwhile, a survey carried out by the PRA found that 70 percent of U.K. banks recognize the risk climate change poses to their business. Among their concerns are the immediate physical risks to their business models — such as the exposure to mortgages on properties at risk of flood and exposure to countries likely to be impacted by increasing weather extremes. Many have also started to assess how the transition to a low-carbon economy will impact their business models and, in many cases, their investment and growth strategy. “Financial policymakers will not drive the transition to a low-carbon economy, but we will expect our regulated firms to anticipate and manage the risks associated with that transition,” said Bank of England Governor Mark Carney, in a statement. The transition to a low-carbon economy is a reality that (re)insurance industry players will need to prepare for, with the impact already being felt in some markets. In Australia, for instance, there is pressure on financial institutions to withdraw their support from major coal projects. In the aftermath of the Townsville floods in February 2019 and widespread drought across Queensland, there have been renewed calls to boycott plans for Australia’s largest thermal coal mine. To date, 10 of the world’s largest (re)insurers have stated they will not provide property or construction cover for the US$15.5 billion Carmichael mine and rail project. And in its “Mining Risk Review 2018,” broker Willis Towers Watson warned that finding insurance for coal “is likely to become increasingly challenging — especially if North American insurers begin to follow the European lead.”
