


EXPOSURE
The RMS Magazine with a unique perspective and clear mission “... to provide insight and analysis to help insurance and risk professionals innovate, adapt, and deliver.”

Insurance: The next 10 years
Mohsen Rahnama, Cihan Biyikoglu and Moe Khosravy of RMS look to 2029, consider the…
Times Square, New York City
Reset Filters
Opportunity
- 2022
- 2021
- 2020
- 2019
- 2018
- 2017
- 2016
In Total Harmony
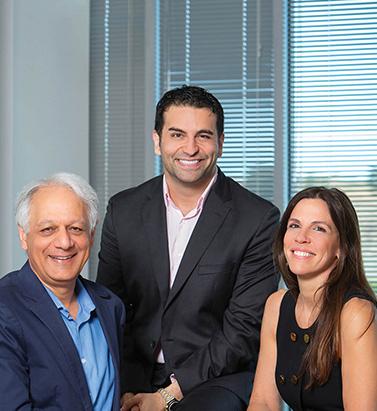
Karen White joined RMS as CEO in March 2018, followed closely by Moe Khosravy, general manager of software and platform activities. EXPOSURE talks to both, along with Mohsen Rahnama, chief risk modeling officer and one of the firm’s most long-standing team members, about their collective vision for the company, innovation, transformation and technology in risk management Karen and Moe, what was it that sparked your interest in joining RMS? Karen: What initially got me excited was the strength of the hand we have to play here and the fact that the insurance sector is at a very interesting time in its evolution. The team is fantastic — one of the most extraordinary groups of talent I have come across. At our core, we have hundreds of Ph.D.s, superb modelers and scientists, surrounded by top engineers, and computer and data scientists. I firmly believe no other modeling firm holds a candle to the quality of leadership and depth and breadth of intellectual property at RMS. We are years ahead of our competitors in terms of the products we deliver. Moe: For me, what can I say? When Karen calls with an idea it’s very hard to say no! However, when she called about the RMS opportunity, I hadn’t ever considered working in the insurance sector. My eureka moment came when I looked at the industry’s challenges and the technology available to tackle them. I realized that this wasn’t simply a cat modeling property insurance play, but was much more expansive. If you generalize the notion of risk and loss, the potential of what we are working on and the value to the insurance sector becomes much greater. I thought about the technologies entering the sector and how new developments on the AI [artificial intelligence] and machine learning front could vastly expand current analytical capabilities. I also began to consider how such technologies could transform the sector’s cost base. In the end, the decision to join RMS was pretty straightforward. “Developments such as AI and machine learning are not fairy dust to sprinkle on the industry’s problems” Karen White CEO, RMS Karen: The industry itself is reaching a eureka moment, which is precisely where I love to be. It is at a transformational tipping point — the technology is available to enable this transformation and the industry is compelled to undertake it. I’ve always sought to enter markets at this critical point. When I joined Oracle in the 1990s, the business world was at a transformational point — moving from client-server computing to Internet computing. This has brought about many of the huge changes we have seen in business infrastructure since, so I had a bird’s-eye view of what was a truly extraordinary market shift coupled with a technology shift. That experience made me realize how an architectural shift coupled with a market shift can create immense forward momentum. If the technology can’t support the vision, or if the challenges or opportunities aren’t compelling enough, then you won’t see that level of change occur. Do (re)insurers recognize the need to change and are they willing to make the digital transition required? Karen: I absolutely think so. There are incredible market pressures to become more efficient, assess risks more effectively, improve loss ratios, achieve better business outcomes and introduce more beneficial ways of capitalizing risk. You also have numerous new opportunities emerging. New perils, new products and new ways of delivering those products that have huge potential to fuel growth. These can be accelerated not just by market dynamics but also by a smart embrace of new technologies and digital transformation. Mohsen: Twenty-five years ago when we began building models at RMS, practitioners simply had no effective means of assessing risk. So, the adoption of model technology was a relatively simple step. Today, the extreme levels of competition are making the ability to differentiate risk at a much more granular level a critical factor, and our model advances are enabling that. In tandem, many of the Silicon Valley technologies have the potential to greatly enhance efficiency, improve processing power, minimize cost, boost speed to market, enable the development of new products, and positively impact every part of the insurance workflow. Data is the primary asset of our industry — it is the source of every risk decision, and every risk is itself an opportunity. The amount of data is increasing exponentially, and we can now capture more information much faster than ever before, and analyze it with much greater accuracy to enable better decisions. It is clear that the potential is there to change our industry in a positive way. The industry is renowned for being risk averse. Is it ready to adopt the new technologies that this transformation requires? Karen: The risk of doing nothing given current market and technology developments is far greater than that of embracing emerging tech to enable new opportunities and improve cost structures, even though there are bound to be some bumps in the road. I understand the change management can be daunting. But many of the technologies RMS is leveraging to help clients improve price performance and model execution are not new. AI, the Cloud and machine learning are already tried and trusted, and the insurance market will benefit from the lessons other industries have learned as it integrates these technologies. “The sector is not yet attracting the kind of talent that is attracted to firms such as Google, Microsoft or Amazon — and it needs to” Moe Khosravy EVP, Software and Platform, RMS Moe: Making the necessary changes will challenge the perceived risk-averse nature of the insurance market as it will require new ground to be broken. However, if we can clearly show how these capabilities can help companies be measurably more productive and achieve demonstrable business gains, then the market will be more receptive to new user experiences. Mohsen: The performance gains that technology is introducing are immense. A few years ago, we were using computation fluid dynamics to model storm surge. We were conducting the analysis through CPU [central processing unit] microprocessors, which was taking weeks. With the advent of GPU [graphics processing unit] microprocessors, we can carry out the same level of analysis in hours. When you add the supercomputing capabilities possible in the Cloud, which has enabled us to deliver HD-resolution models to our clients — in particular for flood, which requires a high-gradient hazard model to differentiate risk effectively — it has enhanced productivity significantly and in tandem price performance. Is an industry used to incremental change able to accept the stepwise change technology can introduce? Karen: Radical change often happens in increments. The change from client-server to Internet computing did not happen overnight, but was an incremental change that came in waves and enabled powerful market shifts. Amazon is a good example of market leadership out of digital transformation. It launched in 1994 as an online bookstore in a mature, relatively sleepy industry. It evolved into broad e-commerce and again with the introduction of Cloud services when it launched AWS [Amazon Web Services] 12 years ago — now a US$17 billion business that has disrupted the computer industry and is a huge portion of its profit. Amazon has total revenue of US$178 billion from nothing over 25 years, having disrupted the retail sector. Retail consumption has changed dramatically, but I can still go shopping on London’s Oxford Street and about 90 percent of retail is still offline. My point is, things do change incrementally but standing still is not a great option when technology-fueled market dynamics are underway. Getting out in front can be enormously rewarding and create new leadership. However, we must recognize that how we introduce technology must be driven by the challenges it is being introduced to address. I am already hearing people talk about developments such as AI, machine learning and neural networks as if they are fairy dust to sprinkle on the industry’s problems. That is not how this transformation process works. How are you approaching the challenges that this transformation poses? Karen: At RMS, we start by understanding the challenges and opportunities from our customers’ perspectives and then look at what value we can bring that we have not brought before. Only then can we look at how we deliver the required solution. Moe: It’s about having an “outward-in” perspective. We have amazing technology expertise across modeling, computer science and data science, but to deploy that effectively we must listen to what the market wants. We know that many companies are operating multiple disparate systems within their networks that have simply been built upon again and again. So, we must look at harnessing technology to change that, because where you have islands of data, applications and analysis, you lose fidelity, time and insight and costs rise. Moe: While there is a commonality of purpose spanning insurers, reinsurers and brokers, every organization is different. At RMS, we must incorporate that into our software and our platforms. There is no one-size-fits-all and we can’t force everyone to go down the same analytical path. That’s why we are adopting a more modular approach in terms of our software. Whether the focus is portfolio management or underwriting decision-making, it’s about choosing those modules that best meet your needs. “Data is the primary asset of our industry — it is the source of every risk decision, and every risk is itself an opportunity” Mohsen Rahmana, PhD Chief Risk Modeling Officer, RMS Mohsen: When constructing models, we focus on how we can bring the right technology to solve the specific problems our clients have. This requires a huge amount of critical thinking to bring the best solution to market. How strong is the talent base that is helping to deliver this level of capability? Mohsen: RMS is extremely fortunate to have such a fantastic array of talent. This caliber of expertise is what helps set us apart from competitors, enabling us to push boundaries and advance our modeling capabilities at the speed we are. Recently, we have set up teams of modelers and data and computer scientists tasked with developing a range of innovations. It’s fantastic having this depth of talent, and when you create an environment in which innovative minds can thrive you quickly reap the rewards — and that is what we are seeing. In fact, I have seen more innovation at RMS in the last six months than over the past several years. Moe: I would add though that the sector is not yet attracting the kind of talent seen at firms such as Google, Microsoft or Amazon, and it needs to. These companies are either large-scale customer-service providers capitalizing on big data platforms and leading-edge machine-learning techniques to achieve the scale, simplicity and flexibility their customers demand, or enterprises actually building these core platforms themselves. When you bring new blood into an organization or industry, you generate new ideas that challenge current thinking and practices, from the user interface to the underlying platform or the cost of performance. We need to do a better PR job as a technology sector. The best and brightest people in most cases just want the greatest problems to tackle — and we have a ton of those in our industry. Karen: The critical component of any successful team is a balance of complementary skills and capabilities focused on having a high impact on an interesting set of challenges. If you get that dynamic right, then that combination of different lenses correctly aligned brings real clarity to what you are trying to achieve and how to achieve it. I firmly believe at RMS we have that balance. If you look at the skills, experience and backgrounds of Moe, Mohsen and myself, for example, they couldn’t be more different. Bringing Moe and Mohsen together, however, has quickly sparked great and different thinking. They work incredibly well together despite their vastly different technical focus and career paths. In fact, we refer to them as the “Moe-Moes” and made them matching inscribed giant chain necklaces and presented them at an all-hands meeting recently. Moe: Some of the ideas we generate during our discussions and with other members of the modeling team are incredibly powerful. What’s possible here at RMS we would never have been able to even consider before we started working together. Mohsen: Moe’s vast experience of building platforms at companies such as HP, Intel and Microsoft is a great addition to our capabilities. Karen brings a history of innovation and building market platforms with the discipline and the focus we need to deliver on the vision we are creating. If you look at the huge amount we have been able to achieve in the months that she has been at RMS, that is a testament to the clear direction we now have. Karen: While we do come from very different backgrounds, we share a very well-defined culture. We care deeply about our clients and their needs. We challenge ourselves every day to innovate to meet those needs, while at the same time maintaining a hell-bent pragmatism to ensure we deliver. Mohsen: To achieve what we have set out to achieve requires harmony. It requires a clear vision, the scientific know-how, the drive to learn more, the ability to innovate and the technology to deliver — all working in harmony. Career Highlights Karen White is an accomplished leader in the technology industry, with a 25-year track record of leading, innovating and scaling global technology businesses. She started her career in Silicon Valley in 1993 as a senior executive at Oracle. Most recently, Karen was president and COO at Addepar, a leading fintech company serving the investment management industry with data and analytics solutions. Moe Khosravy (center) has over 20 years of software innovation experience delivering enterprise-grade products and platforms differentiated by data science, powerful analytics and applied machine learning to help transform industries. Most recently he was vice president of software at HP Inc., supporting hundreds of millions of connected devices and clients. Mohsen Rahnama leads a global team of accomplished scientists, engineers and product managers responsible for the development and delivery of all RMS catastrophe models and data. During his 20 years at RMS, he has been a dedicated, hands-on leader of the largest team of catastrophe modeling professionals in the industry.


A Risk-Driven Business
Following Tower Insurance’s switch to risk-based pricing in New Zealand, EXPOSURE examines how recent market developments may herald a more fundamental industry shift The ramifications of the Christchurch earthquakes of 2010-11 continue to reverberate through the New Zealand insurance market. The country’s Earthquake Commission (EQC), which provides government-backed natural disaster insurance, is forecast to have paid around NZ$11 billion (US$7.3 billion) by the time it settles its final claim. The devastating losses exposed significant shortfalls in the country’s insurance market. These included major deficiencies in insurer data, gaps in portfolio management and expansive policy wordings that left carriers exposed to numerous unexpected losses. Since then, much has changed. Policy terms have been tightened, restrictions have been introduced on coverage and concerted efforts have been made to bolster databases. On July 1, 2019, the EQC increased the cap limit on the government-mandated residential cover it provides to all householders from NZ$100,000 (US$66,000) (a figure set in 1993) to NZ$150,000. A significant increase, but well below the average house price in New Zealand as of December 2017, which stood at NZ$669,565, and an average rebuild cost of NZ$350,000. It has also removed contents coverage. More recently, however, one development has taken place that has the potential to have a much more profound impact on the market. Risk-Based Pricing In March 2018, New Zealand insurer Tower Insurance announced a move to risk-based pricing for home insurance. It aims to ensure premium levels are commensurate with individual property risk profiles, with those in highly exposed areas experiencing a price rise on the earthquake component of their coverage. Describing the shift as a “fairer and more equitable way of pricing risk,” Tower CEO Richard Harding says this was the “right thing to do” both for the “long-term benefit of New Zealand” and for customers, with risk-based pricing “the fairest way to distribute the costs we face as an insurer.” The move has generated much media coverage, with stories highlighting instances of triple-digit percentage hikes in earthquake-prone regions such as Wellington. Yet, what has generated significantly fewer column inches has been the marginal declines available to the vast majority of households in the less seismically active regions, as the high-risk earthquake burden on their premium is reduced. A key factor in Tower’s decision was the increasing quality and granularity of the underwriting data at its disposal. “Tower has always focused on the quality of its data and has invested heavily in ensuring it has the highest-resolution information available,” says Michael Drayton, senior risk modeler for RMS, based in New Zealand. “The earthquakes generated the most extensive liquefaction in a built-up area seen in a developed country” Michael Drayton RMS In fact, in the aftermath of the Christchurch earthquakes, RMS worked with Tower as RMS rebuilt its New Zealand High-Definition (HD) Earthquake Model due to the caliber of their data. Prior to the earthquake, claims data was in very short supply given that there had been few previous events with large-scale impacts on highly built-up areas. “On the vulnerability side,” Drayton explains, “we had virtually no local claims data to build our damage functions. Our previous model had used comparisons of building performance in other earthquake-exposed regions. After Christchurch, we suddenly had access to billions of dollars of claims information.” RMS sourced data from numerous parties, including EQC and Tower, as well as geoscience research firm GNS Science, as it reconstructed the model from this swell of data. “RMS had a model that had served the market well for many years,” he explains. “On the hazard side, the fundamentals remained the same — the highest hazard is along the plate boundary, which runs offshore along the east coast of North Island traversing over to the western edge of South Island. But we had now gathered new information on fault lines, activity rates, magnitudes and subduction zones. We also updated our ground motion prediction equations.” One of the most high-profile model developments was the advanced liquefaction module. “The 2010-11 earthquakes generated probably the most extensive liquefaction in a built-up area seen in a developed country. With the new information, we were now able to capture the risk at much higher gradients and in much greater resolution,” says Drayton. This data surge enabled RMS to construct its New Zealand Earthquake HD Model on a variable resolution grid set at a far more localized level. In turn, this has helped give Tower sufficient confidence in the granularity and accuracy of its data at the property level to adopt risk-based pricing. The Ripple Effects As homeowners received their renewal notices, the reality of risk-based pricing started to sink in. Tower is the third-largest insurer for domestic household, contents and private motor cover in New Zealand and faces stiff competition. Over 70 percent of the market is in the hands of two players, with IAG holding around 47 percent and Suncorp approximately 25 percent. News reports also suggested movement from the larger players. AMI and State, both owned by IAG, announced that three-quarters of its policyholders — those at heightened risk of earthquake, landslide or flood — will see an average annual premium increase of NZ$91 (US$60); the remaining quarter at lower risk will see decreases averaging NZ$54 per year. A handful of households could see increases or decreases of up to NZ$1,000. According to the news website Stuff, IAG has not changed premiums for its NZI policyholders, with NZI selling house insurance policies through brokers. “One interesting dynamic is that a small number of start-ups are now entering the market with the same risk-based pricing stance taken by Tower,” Drayton points out. “These are companies with new purpose-built IT systems that are small and nimble and able to target niche sectors.” “It’s certainly a development to watch closely,” he continues, “as it raises the potential for larger players, if they are not able to respond effectively, being selected against. It will be interesting to see if the rate of these new entrants increases.” The move from IAG suggests risk-based pricing will extend beyond the earthquake component of cover to flood-related elements. “Flood is not a reinsurance peril for New Zealand, but it is an attritional one,” Drayton points out. “Then there is the issue of rising sea levels and the potential for coastal flooding, which is a major cause for concern. So, the risk-based pricing shift is feeding into climate change discussions too.” A Fundamental Shift Policyholders in risk-exposed areas such as Wellington were almost totally unaware of how much higher their insurance should be based on their property exposure, largely shielded away from the risk reality of earthquakes in recent years. The move to risk-based pricing will change that. “The market shifts we are seeing today pose a multitude of questions and few clear answers” Michael Drayton RMS Drayton agrees that recent developments are opening the eyes of homeowners. “There is a growing realization that New Zealand’s insurance market has operated very differently from other insurance markets and that that is now changing.” One major marketwide development in recent years has been the move from full replacement cover to fixed sums insured in household policies. “This has a lot of people worried they might not be covered,” he explains. “Whereas before, people simply assumed that in the event of a big loss the insurer would cover it all, now they’re slowly realizing it no longer works like that. This will require a lot of policyholder education and will take time.” At a more foundational level, current market dynamics also address the fundamental role of insurance, exposing the conflicted role of the insurer as both a facilitator of risk pooling and a profit-making enterprise. When investment returns outweighed underwriting profit, it appeared as if cross-subsidization wasn’t a big issue. However, current dynamics has meant the operating model is squarely focused on underwriting returns — to favor risk-based pricing. Cross-subsidization is the basis upon which EQC is built, but is it fair? Twenty cents in every NZ$100 (US$66) of home or contents fire insurance premium, up to a maximum of NZ$100,000 insured, is passed on to the EQC. While to date there has been limited government response to risk-based pricing, it is monitoring the situation closely given the broader implications. Looking globally, in an RMS blog, chief research officer Robert Muir-Wood also raises the question whether “flat-rated” schemes, like the French cat nat scheme, will survive now that it has become clear how to use risk models to calculate the wide differentials in the underlying cost of the risk. He asks whether “such schemes are established in the name of ‘solidarity’ or ignorance?” While there is no evidence yet, current developments raise the potential for certain risks to become uninsurable. Increasingly granular data combined with the drive for greater profitability may cause a downward spiral in a market built on a shared burden. Drayton adds: “Potential uninsurability has more to do with land-use planning and building consent regimes, and insurers shouldn’t be paying the price for poor planning decisions. Ironically, earthquake loading codes are very sophisticated and have evolved to recognize the fine gradations in earthquake risk provided by localized data. In fact, they are so refined that structural engineers remark that they are too nuanced and need to be simpler. But if you are building in a high-risk area, it’s not just designing for the hazard, it is also managing the potential financial risk.” He concludes: “The market shifts we are seeing today pose a multitude of questions and few clear answers. However, the only constant running through all these discussions is that they are all data driven.” Making the Move Key to understanding the rationale behind the shift to risk-based pricing is understanding the broader economic context of New Zealand, says Tower CEO Richard Harding. “The New Zealand economy is comparatively small,” he explains, “and we face a range of unique climatic and geological risks. If we don’t plan for and mitigate these risks, there is a chance that reinsurers will charge insurers more or restrict cover. “Before this happens, we need to educate the community, government, councils and regulators, and by moving toward risk-based pricing, we’re putting a signal into the market to drive social change through these organizations. “These signals will help demonstrate to councils and government that more needs to be done to plan for and mitigate natural disasters and climate change.” Harding feels that this risk-based pricing shift is a natural market evolution. “When you look at global trends, this is happening around the world. So, given that we face a number of large risks here in New Zealand, in some respects, it’s surprising it hasn’t happened sooner,” he says. While some parties have raised concerns that there may be a fall in insurance uptake in highly exposed regions, Harding does not believe this will be the case. “For the average home, insurance may be more expensive than it currently is, but it won’t be unattainable,” he states. Moving forward, he says that Tower is working to extend its risk-based pricing approach beyond the earthquake component of its cover, stating that the firm “is actively pursuing risk-based pricing for flood and other natural perils, and over the long term we would expect other insurers to follow in our footsteps.” In terms of the potential wider implications if this occurs, Harding says that such a development would compel government, councils and other organizations to change how they view risk in their planning processes. “I think it will start to drive customers to consider risk more holistically and take this into account when they build and buy homes,” he concludes.


Brazil: Modeling the World's Future Breadbasket
How a crop modeling collaboration with IRB Brasil Re could help bridge the protection gap and build a more resilient agricultural base for the future in Brazil Brazil is currently the world’s second largest corn exporter, and is set to overtake the U.S. as the globe’s biggest soybean exporter, with the U.S. Department of Agriculture (USDA) predicting a record Brazilian soybean crop of 115 million metric tons in its outlook for 2018. Yet this agricultural powerhouse — responsible for around a quarter of Brazil’s GDP — remains largely underinsured, according to Victor Roldán, vice president and head of Caribbean and Latin America at RMS. A situation that must be addressed given the importance of the sector for the country’s economy and growing weather extremes farmers must contend with under climate change conditions. The effects of climate change over the next 25 years could lead to further heavy crop losses “Natural perils are identified as the industry’s main risk,” he says. “Major droughts or excess of rain have been big drivers of losses for the sector, and their frequency and severity shall increase under future climate change conditions. During 2014 to 2017, El Niño affected Brazil with some of the largest droughts in some areas of the country and excess of rain in others. “There is a need to structure more effective and attractive insurance products to protect the farmers,” he continues. “For this we need better analytics, a better understanding of the perils, exposure and vulnerability.” Worst Drought in 80 Years The worst drought in 80 years reached its height in 2015, with farmers in Sao Paulo losing up to a third of their crops due to the dry weather. Production of soy shrank by 17 percent between 2013 and 2014 while around a fifth of the state’s citrus crops died. Meanwhile, heavy rain and flash floods in the south of the country also detrimentally impacted agricultural output. The effects of climate change over the next 25 years could lead to further heavy crop losses, according to a study carried out by Brazil’s Secretariat of Strategic Issues (SAE). It found that some of the country’s main crops could suffer a serious decline in the areas already under cultivation, anticipating a decline of up to 39 percent in the soybean crop. This could translate into significant financial losses, since the soybean crop currently brings in around US$20 billion in export earnings annually. IRB Brasil Re has been the leader in the agricultural reinsurance sector of the country for decades and has more than 70 years of agricultural claims data. Today agricultural risks represent its second-largest business line after property. However, insurance penetration remains low in the agricultural sector, and IRB has been seeking ways in which to encourage take-up among farmers. The 2015 drought was a turning point, explains Roldán. “As the largest reinsurance player in Brazil, IRB needed to address in a more systematic way the recorded 16.3 percent increase in claims. The increase was due to the drought in the Midwestern region, which adversely affected corn, soybean and coffee crops and, separately an increase in the historical average rainfall level in the Southern region, which caused damage to the crops.” Building a Probabilistic Crop Model A better crop-weather modeling approach and risk analytics of crop perils will help the market to better understand their risks and drive growth in crop insurance penetration. IRB is partnering with RMS to develop the first fully probabilistic hybrid crop model for the agricultural insurance sector in Brazil, which it is planning to roll out to its cedants. The model will assess crop risks linked with weather drivers, such as drought, excess rainfall, temperature variation, hail events, strong wind and other natural hazards that impact crop yield variability. The model will be suited for different crop insurance products such as named perils (hail, frost, etc.), Multiple-Peril Crop Insurance (MPCI) and revenue covers, and will also include livestock and forestry. “Major droughts or excess of rain have been big drivers of losses for the sector, but also climate change is a worrying trend” Victor Roldán RMS “Weather-driven impacts on crop production are complex perils to model given the natural variability in space and time, the localized nature of the hazards and the complex vulnerability response depending on the intensity, but also on the timing of occurrence,” explains Olivier Bode, manager, global agricultural risk at RMS. “For instance, plant vulnerability not only depends on the intensity of the stress but also on the timing of the occurrence, and the crop phenology or growth stage, which in turn depends on the planting date and the selected variety along with the local weather and soil conditions,” he continues. “Thus, exposure information is critical as you need to know which variety the farmer is selecting and its corresponding planting date to make sure you’re representing correctly the impacts that might occur during a growing season. The hybrid crop model developed by RMS for IRB has explicit modules that account for variety specific responses and dynamic representation of crop growth stages.” The model will rely on more than historical data. “That’s the major advantage of using a probabilistic crop-weather modeling approach,” says Bode. “Typically, insurers are looking at historical yield data to compute actuarial losses and they don’t go beyond that. A probabilistic framework allows insurers to go beyond the short historical yield record, adding value by coupling longer weather time series with crop models. They also allow you to capture future possible events that are not recorded in past weather data, for example, drought events that might span over several years, flood occurrences extending over larger or new areas as well as climate change related impacts. This allows you to calculate exceedance probability losses at different return periods for each crop and for specific scenarios.” There is also significant potential to roll out the model to other geographies in the future, with Colombia currently looking like the obvious next step and opportunity. “The El Niño weather phenomenon affects all of Latin America; it decreases rains by more than 60 percent during the rainy seasons in many countries,” explains Roldán. “Like Brazil, Colombia is a very biologically diverse country and features a variety of ecosystems. Currently, most of the country has under-utilized agricultural land.” Colombia is already a key player worldwide in two products: coffee and cut flowers. But the country signed a number of free trade agreements that will give its producers more access to foreign markets. “So, the expansion of agribusiness insurance is urgently needed in Colombia,” says Roldán.


A Burgeoning Opportunity
As traditional (re)insurers hunt for opportunity outside of property catastrophe classes, new probabilistic casualty catastrophe models are becoming available. At the same time, as catastrophe risks are becoming increasingly “manufactured” or human-made, so casualty classes have the potential to be the source of claims after a large “natural” catastrophe. Just as the growing sophistication of property catastrophe models has enabled industry innovation, there is growing excitement that new tools available to casualty (re)insurers could help to expand the market. By improved evaluation of casualty clash exposures, reinsurers will be better able to understand, price and manage their exposures, as well as design new products that cater to underserved areas. However, the casualty market must switch from pursuing a purely defensive strategy. “There is an ever-growing list of exclusions in liability insurance and interest in the product is declining with the proliferation of these exclusions,” explains Dr. Robert Reville, president and CEO of Praedicat, the world’s first liability catastrophe modeling company. “There is a real growth opportunity for the industry to deal with these exclusions and recognize where they can confidently write more business. “Industry practitioners look at what’s happened in property — where modeling has led to a lot of new product ideas, including capital market solutions, and a lot of innovation — and casualty insurers are hungry for that sort of innovation, for the same sort of transformation in liability that happened in property,” he adds. Perils — particularly emerging risks that underwriters have struggled to price, manage and understand — have typically been excluded from casualty products. This includes electromagnetic fields (EMFs), such as those emanating from broadcast antennas and cell phones. Cover for such exposures is restricted, particularly for the U.S. market, where it is often excluded entirely. Some carriers will not offer any cover at all if the client has even a remote exposure to EMF risks. Yet are they being over-apprehensive about the risk? The fear that leads to an over application of exclusions is very tangible. “The latency of the disease development process — or the way a product might be used, with more people becoming exposed over time — causes there to be a build-up of risk that may result in catastrophe,” Reville continues. “Insurers want to be relevant to insuring innovation in product, but they have to come to terms with the latency and the potential for a liability catastrophe that might emerge from it.” Unique Nature of Casualty Catastrophe It is a misconception that casualty is not a catastrophe class of business. Reville points out that the industry’s US$100 billion-plus loss relating to asbestos claims is arguably its biggest-ever catastrophe. Within the Lloyd’s market the overwhelming nature of APH (asbestos, pollution and health) liabilities contributed to the market’s downward spiral in the late 1980s, only brought under control through the formation of the run-off entity Equitas, now owned and managed by Warren Buffett’s Berkshire Hathaway. As the APH claims crisis demonstrated, casualty catastrophes differ from property catastrophes in that they are a “two-tailed loss.” There is the “tail loss” both have in common, which describes the high frequency, low probability characteristics — or high return period — of a major event. But in addition, casualty classes of business are “long-tail” in nature. This means that a policy written in 2017 may not experience a claim until 20 years later, providing an additional challenge from a modeling and reserving perspective. “Casualty insurers are hungry for that sort of innovation, for the same sort of transformation in liability that happened in property” Robert Reville Praedicat Another big difference between casualty clash and property catastrophe from a modeling perspective is that the past is not a good indication of future claims. “By the time asbestos litigation had really taken off, it was already a banned product in the U.S., so it was not as though asbestos claims were any use in trying to figure out where the next environmental disaster or next product liability was going to be,” says Reville. “So, we needed a forward-looking approach to identify where there could be new sources of litigation.” With the world becoming both more interconnected and more litigious, there is every expectation that future casualty catastrophe losses could be much greater and impact multiple classes of business. “The reality is there’s serial aggregation and systemic risk within casualty business, and our answer to that has generally been that it’s too difficult to quantify,” says Nancy Bewlay, chief underwriting officer, global casualty, at XL Catlin. “But the world is changing. We now have technology advances and data collection capabilities we never had before, and public information that can be used in the underwriting process. “Take the Takata airbag recall,” she continues. “In 2016, they had to recall 100 million airbags worldwide. It affected all the major motor manufacturers, who then faced the accumulation potential not only of third-party liability claims, but also product liability and product recall. Everything starts to accumulate and combine within that one industry, and when you look at the economic footprint of that throughout the supply chain there’s a massive potential for a casualty catastrophe when you see how everything is interconnected.” RMS chief research officer Robert Muir-Wood explains: “Another area where we can expect an expansion of modeling applications concerns casualty lines picking up losses from more conventional property catastrophes. This could occur when the cause of a catastrophe can be argued to have ‘non-natural’ origins, and particularly where there are secondary ‘cascade’ consequences of a catastrophe — such as a dam failing after a big earthquake or for claims on ‘professional lines’ coverages of builders and architects — once it is clear that standard property insurance lines will not compensate for all the building damage.” “This could be prevalent in regions with low property catastrophe insurance penetration, such as in California, where just one in ten homeowners has earthquake cover. In the largest catastrophes, we could expect claims to be made against a wide range of casualty lines. The big innovation around property catastrophe in particular was to employ high-resolution GIS [geographic information systems] data to identify the location of all the risk. We need to apply similar location data to casualty coverages, so that we can estimate the combined consequences of a property/casualty clash catastrophe.” One active instance, cited by Muir-Wood, of this shift from property to casualty cover- ages concerns earthquakes in Oklahoma. “There are large amounts of wastewater left over from fracking, and the cheapest way of disposing of it is to pump it down deep boreholes. But this process has been triggering earthquakes, and these earthquakes have started getting quite big — the largest so far in September 2016 had a magnitude of M5.8. “At present the damage to buildings caused by these earthquakes is being picked up by property insurers,” he continues. “But what you will see over time are lawsuits to try and pass the costs back to the operators of the wells themselves. Working with Praedicat, RMS has done some modeling work on how these operators can assess the risk cost of adding a new disposal well. Clearly the larger the earthquake, the less likely it is to occur. However, the costs add up: our modeling shows that an earthquake bigger than M6 right under Oklahoma City could cause more than US$10 billion of damage.” Muir-Wood adds: “The challenge is that casualty insurance tends to cover many potential sources of liability in the contract and the operators of the wells, and we believe their insurers are not currently identifying this particular — and potentially catastrophic —source of future claims. There’s the potential for a really big loss that would eventually fall onto the liability writers of these deep wells … and they are not currently pricing for this risk, or managing their portfolios of casualty lines.” A Modeled Class of Business According to Reville, the explosion of data and development of data science tools have been key to the development of casualty catastrophe modeling. The opportunity to develop probabilistic modeling for casualty classes of business was born in the mid-2000s when Reville was senior economist at the RAND Corporation. At that time, RAND was using data from the RMS® Probabilistic Terrorism Model to help inform the U.S. Congress in its decision on the renewal of the Terrorism Risk Insurance Act (TRIA). Separately, it had written a paper on the scope and scale of asbestos litigation and its potential future course. “As we were working on these two things it occurred to us that here was this US$100 billion loss — this asbestos problem — and adjacently within property catastrophe insurance there was this developed form of analytics that was helping insurers solve a similar problem. So, we decided to work together to try and figure out if there was a way of solving the problem on the liability side as well,” adds Reville. Eventually Praedicat was spun out of the initial project as its own brand, launching its first probabilistic liability catastrophe model in summer 2016. “The industry has evolved a lot over the past five years, in part driven by Solvency II and heightened interest from the regulators and rating agencies,” says Reville. “There is a greater level of concern around the issue, and the ability to apply technologies to understand risk in new ways has evolved a lot.” There are obvious benefits to (re)insurers from a pricing and exposure management perspective. “The opportunity is changing the way we underwrite,” says Bewlay. “Historically, we underwrote by exclusion with a view to limiting our maximum loss potential. We couldn’t get a clear understanding of our portfolio because we weren’t able to. We didn’t have enough meaningful, statistical and credible data.” “We feel they are not being proactive enough because … there’s the potential for a really big loss that would fall onto the liability writers of these deep wells” Robert Muir-Wood RMS Then there are the exciting opportunities for growth in a market where there is intense competition and downward pressure on rates. “Now you can take a view on the ‘what-if’ scenario and ask: how much loss can I handle and what’s the probability of that happening?” she continues. “So, you can take on managed risk. Through the modeling you can better understand your industry classes and what could happen within your portfolio, and can be slightly more opportunistic in areas where previously you may have been extremely cautious.” Not only does this expand the potential range of casualty insurance and reinsurance products, it should allow the industry to better support developments in burgeoning industries. “Cyber is a classic example,” says Bewlay. “If you can start to model the effects of a cyber loss you might decide you’re OK providing cyber in personal lines for individual homeowners in addition to providing cyber in a traditional business or technology environment. “You would start to model all three of these scenarios and what your potential market share would be to a particular event, and how that would impact your portfolio,” she continues. “If you can answer those questions utilizing your classic underwriting and actuarial techniques, a bit of predictive modeling in there — this is the blend of art and science — you can start taking opportunities that possibly you couldn’t before.”


The Lay of The Land
China has made strong progress in developing agricultural insurance and aims to continually improve. As farming practices evolve, and new capabilities and processes enhance productivity, how can agricultural insurance in China keep pace with trending market needs? EXPOSURE investigates. The People’s Republic of China is a country of immense scale. Covering some 9.6 million square kilometers (3.7 million square miles), just two percent smaller than the U.S., the region spans five distinct climate areas with a diverse topography extending from the lowlands to the east and south to the immense heights of the Tibetan Plateau. Arable land accounts for approximately 135 million hectares (521,238 square miles), close to four times the size of Germany, feeding a population of 1.3 billion people. In total, over 1,200 crop varieties are cultivated, ranging from rice and corn to sugar cane and goji berries. In terms of livestock, some 20 species covering over 740 breeds are found across China; while it hosts over 20,000 aquatic breeds, including 3,800 types of fish.1 A Productive Approach With per capita land area less than half of the global average, maintaining agricultural output is a central function of the Chinese government, and agricultural strategy has formed the primary focus of the country’s “No. 1 Document” for the last 14 years. To encourage greater efficiency, the central government has sought to modernize methods and promote large-scale production, including the creation of more agriculture cooperatives, including a doubling of agricultural machinery cooperatives encouraging mechanization over the last four years.2 According to the Ministry of Agriculture, by the end of May 2015 there were 1.393 million registered farming cooperatives, up 22.4 percent from 2014 — a year that saw the government increase its funding for these specialized entities by 7.5 percent to ¥2 billion (US$0.3 billion). Changes in land allocation are also dramatically altering the landscape. In April 2017, the minister of agriculture, Han Changfu, announced plans to assign agricultural production areas to two key functions over the next three years, with 900 million mu (60 million hectares) for primary grain products, such as rice and wheat, and 238 million mu (16 million hectares) for five other key products, including cotton, rapeseed and natural rubber. Productivity levels are also being boosted by enhanced farming techniques and higher-yield crops, with new varieties of crop including high-yield wheat and “super rice” increasing annual tonnage. Food grain production has risen from 446 million tons in 1990 to 621 million tons in 2015.3 The year 2016 saw a 0.8 percent decline — the first in 12 years — but structural changes were a contributory factor. Insurance Penetration China is one of the most exposed regions in the world to natural catastrophes. Historically, China has repeatedly experienced droughts with different levels of spatial extent of damage to crops, including severe widespread droughts in 1965, 2000 and 2007. Frequent flooding also occurs, but with development of flood mitigation schemes, flooding of crop areas is on a downward trend. China has, however, borne the brunt of one the costliest natural catastrophes to date in 2017, according to Aon Benfield,4 with July floods along the Yangtze River basin causing economic losses topping US$6.4 billion. The 2016 summer floods caused some US$28 billion in losses along the river;5 while flooding in northeastern China caused a further US$4.7 billion in damage. Add drought losses of US$6 billion and the annual weather-related losses stood at US$38.7 billion.6 However, insured losses are a fraction of that figure, with only US$1.1 billion of those losses insured. “Often companies not only do not know where their exposures are, but also what the specific policy requirements for that particular region are in relation to terms and conditions” Laurent Marescot RMS The region represents the world’s second largest agricultural insurance market, which has grown from a premium volume of US$100 million in 2006 to more than US$6 billion in 2016. However, government subsidies — at both central and local level — underpin the majority of the market. In 2014, the premium subsidy level ranged from between 65 percent and 80 percent depending on the region and the type of insurance. Most of the insured are small acreage farms, for which crop insurance is based on a named peril but includes multiple peril cover (drought, flood, extreme winds and hail, freeze and typhoon). Loss assessment is generally performed by surveyors from the government, insurers and an individual that represents farmers within a village. Subsidized insurance is limited to specific crop varieties and breeds and primarily covers only direct material costs, which significantly lowers its appeal to the farming community. One negative impact of current multi-peril crop insurance is the cost of operations, thus reducing the impact of subsidies. “Currently, the penetration of crop insurance in terms of the insured area is at about 70 percent,” says Mael He, head of agriculture, China, at Swiss Re. “However, the coverage is limited and the sum insured is low. The penetration is only 0.66 percent in terms of premium to agricultural GDP. As further implementation of land transfer in different provinces and changes in supply chain policy take place, livestock, crop yield and revenue insurance will be further developed.” As He points out, changing farming practices warrant new types of insurance. “For the cooperatives, their insurance needs are very different compared to those of small household farmers. Considering their main income is from farm production, they need insurance cover on yield or event-price-related agricultural insurance products, instead of cover for just production costs in all perils.” At Ground Level Given low penetration levels and limited coverage, China’s agricultural market is clearly primed for growth. However, a major hindering factor is access to relevant data to inform meaningful insurance decisions. For many insurers, the time series of insurance claims is short, government-subsidized agriculture insurance only started in 2007, according to Laurent Marescot, senior director, market and product specialists at RMS. “This a very limited data set upon which to forecast potential losses,” says Marescot. “Given current climate developments and changing weather patterns, it is highly unlikely that during that period we have experienced the most devastating events that we are likely to see. It is hard to get any real understanding of a potential 1-in-100 loss from such data.” Major changes in agricultural practices also limit the value of the data. “Today’s farming techniques are markedly different from 10 years ago,” states Marescot. “For example, there is a rapid annual growth rate of total agricultural machinery power in China, which implies significant improvement in labor and land productivity.” Insurers are primarily reliant on data from agriculture and finance departments for information, says He. “These government departments can provide good levels of data to help insurance companies understand the risk for the current insurance coverage. However, obtaining data for cash crops or niche species is challenging.” “You also have to recognize the complexities in the data,” Marescot believes. “We accessed over 6,000 data files with government information for crops, livestock and forestry to calibrate our China Agricultural Model (CAM). Crop yield data is available from the 1980s, but in most cases it has to be calculated from the sown area. The data also needs to be processed to resolve inconsistencies and possibly de-trended, which is a fairly complex process. In addition, the correlation between crop yield and loss is not great as loss claims are made at a village level and usually involve negotiation.” A Clear Picture Without the right level of data, international companies operating in these territories may not have a clear picture of their risk profile. “Often companies not only have a limited view where their exposures are, but also of what the specific policy requirements for that particular province are in relation to terms and conditions,” says Marescot. “These are complex as they vary significantly from one line of business and province to the next.” A further level of complexity stems from the fact that not only can data be hard to source, but in many instances it is not reported on the same basis from province to province. This means that significant resource must be devoted to homogenizing information from multiple different data streams. “We’ve devoted a lot of effort to ensuring the homogenization of all data underpinning the CAM,” Marescot explains. “We’ve also translated the information and policy requirements from Mandarin into English. This means that users can either enter their own policy conditions into the model or rely upon the database itself. In addition, the model is able to disaggregate low-resolution exposure to higher-resolution information, using planted area data information. All this has been of significant value to our clients.” The CAM covers all three lines of agricultural insurance — crop, livestock and forestry. A total of 12 crops are modeled individually, with over 60 other crop types represented in the model. For livestock, CAM covers four main perils: disease, epidemics, natural disasters and accident/fire for cattle, swine, sheep and poultry. The Technology Age As efforts to modernize farming practices continue, so new technologies are being brought to bear on monitoring crops, mapping supply and improving risk management. “More farmers are using new technology, such as apps, to track the growing conditions of crops and livestock and are also opening this to end consumers so that they can also monitor this online and in real-time,” He says. “There are some companies also trying to use blockchain technology to track the movements of crops and livestock based on consumer interest; for instance, from a piglet to the pork to the dumpling being consumed.” He says, “3S technology — geographic information sciences, remote sensing and global positioning systems — are commonly used in China for agriculture claims assessments. Using a smartphone app linked to remote control CCTV in livestock farms is also very common. These digital approaches are helping farmers better manage risk.” Insurer Ping An is now using drones for claims assessment. There is no doubt that as farming practices in China evolve, the potential to generate much greater information from new data streams will facilitate the development of new products better designed to meet on-the-ground requirements. He concludes: “China can become the biggest agricultural insurance market in the next 10 years. … As the Chinese agricultural industry becomes more professional, risk management and loss assessment experience from international markets and professional farm practices could prove valuable to the Chinese market.” References: 1. Ministry of Agriculture of the People’s Republic of China 2. Cheng Fang, “Development of Agricultural Mechanization in China,” Food and Agriculture Organization of the United Nations, https://forum2017.iamo.de/microsites/forum2017.iamo.de/fileadmin/presentations/B5_Fang.pdf 3. Ministry of Agriculture of the People’s Republic of China 4. Aon Benfield, “Global Catastrophe Recap: First Half of 2017,” July 2017, http://thoughtleadership.aonbenfield.com/Documents/201707-if-1h-global-recap.pdf 5. Aon Benfield, “2016 Annual Global Climate and Catastrophe Report,” http://thoughtleadership.aonbenfield.com/Documents/20170117-ab-ifannualclimate-catastrophe-report.pdf 6. Ibid. The Disaster Plan In April 2017, China announced the launch of an expansive disaster insurance program spanning approximately 200 counties in the country’s primary grain producing regions, including Hebei and Anhui. The program introduces a new form of agriculture insurance designed to provide compensation for losses to crop yields resulting from natural catastrophes, including land fees, fertilizers and crop-related materials. China’s commitment to providing robust disaster cover was also demonstrated in 2016, when Swiss Re announced it had entered into a reinsurance protection scheme with the government of Heilongjiang Province and the Sunlight Agriculture Mutual Insurance Company of China — the first instance of the Chinese government capitalizing on a commercial program to provide cover for natural disasters. The coverage provides compensation to farming families for both harm to life and damage to property as well as income loss resulting from floods, excessive rain, drought and low temperatures. It determines insurance payouts based on triggers from satellite and meteorological data. Speaking at the launch, Swiss Re president for China John Chen said: “It is one of the top priorities of the government bodies in China to better manage natural catastrophe risks, and it has been the desire of the insurance companies in the market to play a bigger role in this sector. We are pleased to bridge the cooperation with an innovative solution and would look forward to replicating the solutions for other provinces in China.”


The Next Step in Convergence
EXPOSURE investigates how traditional reinsurers, recognizing that third-party capital provides an opportunity rather than a threat, are opting to build or buy their own insurance-linked securities (ILS) fund management capabilities. The property catastrophe reinsurance industry has undergone a rapid transformation over the past decade as capital from institutional investors has flooded into the sector. Attracted by solid returns and an asset class that is uncorrelated to their other investments, investors steadily increased their allocations to ILS. At the same time as the resulting demand for product has intensified, collateralized reinsurance has overtaken catastrophe bonds as the dominant source of ILS capacity. As this institutional capital flooded into the peak zones of Florida wind, California earthquake and Japanese wind and earthquake, traditional reinsurers initially felt displaced. Excess capital, several years of benign catastrophe losses and differing risk and return appetites among the so-called “alternative” capital has heightened competition and eroded rates-on-line. 2015 saw a 3.5 percent reduction in traditional capital dedicated to reinsurance, down US$13 billion to US$357 billion according to Willis Re, reflecting the challenging operating environment and record volume of M&A activity among other drivers. The reduction was offset by the continued growth in non-traditional capital, which hit new heights of US$70 billion. Opportunity or Threat? Capital Growth for Dedicated ILS Funds and Reinsurer Third-Party Capital Managers More progressive reinsurance companies recognize this non-traditional capital is here to stay and the opportunities it presents if properly harnessed. While dedicated ILS funds still dominate the market in terms of assets under management, in recent years more reinsurers have sought to leverage these opportunities, setting up their own dedicated ILS funds, sidecars or special purpose syndicates to offer cedants a broader array of risk transfer tools while tapping third-party capital. Aspen, Everest Re, Hannover Re and Munich Re were among those who significantly increased sidecar capital earlier in 2016; there was also marked growth in managed fund capacity by Hiscox (Kiskadee Re), Validus Re (AlphaCat) and Lancashire (Kinesis) among others. Some have sought to access third-party capital by investing in existing players, with Leadenhall’s increased stake in Amlin, Markel’s acquisition of CATCo and Endurance’s acquisition of Blue Capital (as part of its acquisition of Montpelier Re), as recent examples. Managed fund capacity arguably combines the best underwriting with the most efficient forms of capital in the markets where it is deployed. The collateralized reinsurance platforms have access to the track record, underwriting expertise and catastrophe modeling and analytics know-how of the parent company, while the parent company gains access to considerable capital not held within its own balance sheet. Reinsurers are also able to target different business through their third-party management capabilities. Generally, pure ILS funds prefer “cleaner”, modelable business, whereas a traditional reinsurance company has access to the whole market. However, a reinsurer-owned fund is able to leverage the parent company’s existing infrastructure, access to business and its suite of risk management and pricing tools in order to offer something that is different from some of the independent ILS funds. Third-Party Reinsurance Capital Volume ($B) This is attractive to investors, particularly those looking to diversify away from property catastrophe peak perils into other classes of business. One trend for the collateralized reinsurance market is its growth outwards, both by territory and line of business. The ability to apply catastrophe models and exposure management tools in this bid for diversification is becoming a key differentiator for ILS funds. “THE ABILITY TO APPLY CATASTROPHE MODELS AND EXPOSURE MANAGEMENT TOOLS IN THIS BID FOR DIVERSIFICATION IS BECOMING A KEY DIFFERENTIATOR FOR ILS FUNDS.” Lancashire’s Kinesis Capital, for instance, has been set up as a multi-class, fully collateralized reinsurance provider covering specialty classes such as marine among its product offerings, albeit backed by a strong analytical approach. And the trend looks set to continue. In April 2016, ILS publication Artemis noted that the launch of the RMS® Marine Cargo and Specie catastrophe risk model would provide an enhanced approach to marine risk quantification, helping ILS investors and capital to increase participation in the marine insurance and reinsurance market. There are signs that some of the independent funds are recognizing the great benefit of having in-house catastrophe modeling and analytics capabilities, opting to license reinsurance catastrophe models or hire reinsurance talent from markets such as Lloyd’s and Bermuda to bolster their offerings. The boundary between the traditional reinsurance market and ILS arena will continue to blur in the coming years as market players seek to combine the best underwriting – and modeling and analytics expertise – with the most efficient form of capital.
