


EXPOSURE
The RMS Magazine with a unique perspective and clear mission “... to provide insight and analysis to help insurance and risk professionals innovate, adapt, and deliver.”
Insurance: The next 10 years
Mohsen Rahnama, Cihan Biyikoglu and Moe Khosravy of RMS look to 2029, consider the…
Times Square, New York City
Reset Filters
Perils
- 2022
- 2021
- 2020
- 2019
- 2018
- 2017
- 2016
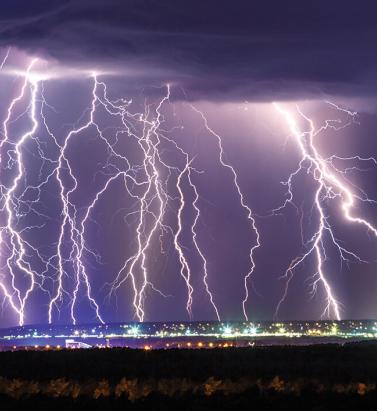
Severe Convective Storms: Experience Cannot Tell the Whole Story
Severe convective storms can strike with little warning across vast areas of the planet, yet some insurers still rely solely on historical records that do not capture the full spectrum of risk at given locations. EXPOSURE explores the limitations of this approach and how they can be overcome with cat modeling Attritional and high-severity claims from severe convective storms (SCS) — tornadoes, hail, straight-line winds and lightning — are on the rise. In fact, in the U.S., average annual insured losses (AAL) from SCS now rival even those from hurricanes, at around US$17 billion, according to the latest RMS U.S. SCS Industry Loss Curve from 2018. In Canada, SCS cost insurers more than any other natural peril on average each year. Despite the scale of the threat, it is often overlooked as a low volatility, attritional peril Christopher Allen RMS “Despite the scale of the threat, it is often overlooked as a low volatility, attritional peril,” says Christopher Allen, product manager for the North American SCS and winterstorm models at RMS. But losses can be very volatile, particularly when considering individual geographic regions or portfolios (see Figure 1). Moreover, they can be very high. “The U.S. experiences higher insured losses from SCS than any other country. According to the National Weather Service Storm Prediction Center, there over 1,000 tornadoes every year on average. But while a powerful tornado does not cause the same total damage as a major earthquake or hurricane, these events are still capable of causing catastrophic losses that run into the billions.” Figure 1: Insured losses from U.S. SCS in the Northeast (New York, Connecticut, Rhode Island, Massachusetts, New Hampshire, Vermont, Maine), Great Plains (North Dakota, South Dakota, Nebraska, Kansas, Oklahoma) and Southeast (Alabama, Mississippi, Louisiana, Georgia). Losses are trended to 2020 and then scaled separately for each region so the mean loss in each region becomes 100. Source: Industry Loss Data Two of the costliest SCS outbreaks to date hit the U.S. in spring 2011. In late April, large hail, straight-line winds and over 350 tornadoes spawned across wide areas of the South and Midwest, including over the cities of Tuscaloosa and Birmingham, Alabama, which were hit by a tornado rating EF-4 on the Enhanced Fujita (EF) scale. In late May, an outbreak of several hundred more tornadoes occurred over a similarly wide area, including an EF-5 tornado in Joplin, Missouri, that killed over 150 people. If the two outbreaks occurred again today, according to an RMS estimate based on trending industry loss data, each would easily cause over US$10 billion of insured loss. However, extreme losses from SCS do not just occur in the U.S. In April 1999, a hailstorm in Sydney dropped hailstones of up to 3.5 inches (9 centimeters) in diameter over the city, causing insured losses of AU$5.6 billion according to the Insurance Council of Australia (ICA), currently the most costly insurance event in Australia’s history [1]. “It is entirely possible we will soon see claims in excess of US$10 billion from a single SCS event,” Allen says, warning that relying on historical data alone to quantify SCS (re)insurance risk leaves carriers underprepared and overexposed. Historical Records are Short and Biased According to Allen, the rarity of SCS at a local level means historical weather and loss data fall short of fully characterizing SCS hazard. In the U.S., the Storm Prediction Center’s national record of hail and straight-line wind reports goes back to 1955, and tornado reports date back to 1950. In Canada, routine tornado reports go back to 1980. “These may seem like adequate records, but they only scratch the surface of the many SCS scenarios nature can throw at us,” Allen says. “To capture full SCS variability at a given location, records should be simulated over thousands, not tens, of years,” he explains. “This is only possible using a cat model that simulates a very wide range of possible storms to give a fuller representation of the risk at that location. Observed over tens of thousands of years, most locations would have been hit by SCS just as frequently as their neighbors, but this will never be reflected in the historical records. Just because a town or city has not been hit by a tornado in recent years doesn’t mean it can’t be.” To capture full SCS variability at a given location, records should be simulated over thousands, not tens, of years Shorter historical records could also misrepresent the severity of SCS possible at a given location. Total insured catastrophe losses in Phoenix, Arizona, for example, were typically negligible between 1990 and 2009, but on October 5, 2010, Phoenix was hit by its largest-ever tornado and hail outbreak, causing economic losses of US$4.5 billion. (Source: NOAA National Centers for Environmental Information) Just like the national observations, insurers’ own claims histories, or industry data such as presented in Figure 1, are also too short to capture the full extent of SCS volatility, Allen warns. “Some primary insurers write very large volumes of natural catastrophe business and have comprehensive claims records dating back 20 or so years, which are sometimes seen as good enough datasets on which to evaluate the risk at their insured locations. However, underwriting based solely on this length of experience could lead to more surprises and greater earnings instability.” If a Tree Falls and No One Hears… Historical SCS records in most countries rely primarily on human observation reports. If a tornado is not seen, it is not reported, which means that unlike a hurricane or large earthquake it is possible to miss SCS in the recent historical record. “While this happens less often in Europe, which has a high population density, missed sightings can distort historical data in Canada, Australia and remote parts of the U.S.,” Allen explains. Another key issue is that the EF scale rates tornado strength based on how much damage is caused, but this does not always reflect the power of the storm. If a strong tornado occurs in a rural area with few buildings, for example, it won’t register high on the EF scale, even though it could have caused major damage to an urban area. “This again makes the historical record very challenging to interpret,” he says. “Catastrophe modelers invest a great deal of time and effort in understanding the strengths and weaknesses of historical data. By using robust aspects of observations in conjunction with other methods, for example numerical weather simulations, they are able to build upon and advance beyond what experience tells us, allowing for more credible evaluation of SCS risk than using experience alone.” Then there is the issue of rising exposures. Urban expansion and rising property prices, in combination with factors such as rising labor costs and aging roofs that are increasingly susceptible to damage, are pushing exposure values upward. “This means that an identical SCS in the same location would most likely result in a higher loss today than 20 years ago, or in some cases may result in an insured loss where previously there would have been none,” Allen explains. Calgary, Alberta, for example, is the hailstorm capital of Canada. On September 7, 1991, a major hailstorm over the city resulted in the country’s largest insured loss to date from a single storm: CA$343 million was paid out at the time. The city has of course expanded significantly since then (see Figure 2), and the value of the exposure in preexisting urban areas has also increased. An identical hailstorm occurring over the city today would therefore cause far larger insured losses, even without considering inflation. Figure 2: Urban expansion in Calgary, Alberta, Canada. European Space Agency. Land Cover CCI Product User Guide Version 2. Tech. Rep. (2017). Available at: maps.elie.ucl.ac.be/CCI/viewer/download/ESACCI-LC-Ph2-PUGv2_2.0.pdf “Probabilistic SCS cat modeling addresses these issues,” Allen says. “Rather than being constrained by historical data, the framework builds upon and beyond it using meteorological, engineering and insurance knowledge to evaluate what is physically possible today. This means claims do not have to be ‘on-leveled’ to account for changing exposures, which may require the user to make some possibly tenuous adjustments and extrapolations; users simply input the exposures they have today and the model outputs today’s risk.” The Catastrophe Modeling Approach In addition to their ability to simulate “synthetic” loss events over thousands of years, Allen argues, cat models make it easier to conduct sensitivity testing by location, varying policy terms or construction classes; to drill into loss-driving properties within portfolios; and to optimize attachment points for reinsurance programs. SCS cat models are commonly used in the reinsurance market, partly because they make it easy to assess tail risk (again, difficult to do using a short historical record alone), but they are currently used less frequently for underwriting primary risks. There are instances of carriers that use catastrophe models for reinsurance business but still rely on historical claims data for direct insurance business. So why do some primary insurers not take advantage of the cat modeling approach? “Though not marketwide, there can be a perception that experience alone represents the full spectrum of SCS risk — and this overlooks the historical record’s limitations, potentially adding unaccounted-for risk to their portfolios,” Allen says. What is more, detailed studies of historical records and claims “on-leveling” to account for changes over time are challenging and very time-consuming. By contrast, insurers who are already familiar with the cat modeling framework (for example, for hurricane) should find that switching to a probabilistic SCS model is relatively simple and requires little additional learning from the user, as the model employs the same framework as for other peril models, he explains. A US$10 billion SCS loss is around the corner, and carriers need to be prepared and have at their disposal the ability to calculate the probability of that occurring for any given location Furthermore, catastrophe model data formats, such as the RMS Exposure and Results Data Modules (EDM and RDM), are already widely exchanged, and now the Risk Data Open Standard™ (RDOS) will have increasing value within the (re)insurance industry. Reinsurance brokers make heavy use of cat modeling submissions when placing reinsurance, for example, while rating agencies increasingly request catastrophe modeling results when determining company credit ratings. Allen argues that with property cat portfolios under pressure and the insurance market now hardening, it is all the more important that insurers select and price risks as accurately as possible to ensure they increase profits and reduce their combined ratios. “A US$10 billion SCS loss is around the corner, and carriers need to be prepared and have at their disposal the ability to calculate the probability of that occurring for any given location,” he says. “To truly understand their exposure, risk must be determined based on all possible tomorrows, in addition to what has happened in the past.” [1] Losses normalized to 2017 Australian dollars and exposure by the ICA. Source: https://www.icadataglobe.com/access-catastrophe-data. To obtain a holistic view of severe weather risk contact the RMS team here


Breaking Down the Pandemic
As COVID-19 has spread across the world and billions of people are on lockdown, EXPOSURE looks at how the latest scientific data can help insurers better model pandemic risk The coronavirus disease 2019 (COVID-19) was declared a pandemic by the World Health Organization (WHO) on March 11, 2020. In a matter of months, it has expanded from the first reported cases in the city of Wuhan in Hubei province, China, to confirmed cases in over 200 countries around the globe. At the time of writing, approximately one-third of the world’s population is in some form of lockdown, with movement and activities restricted in an effort to slow the disease’s spread. The transmissibility of COVID-19 is truly global, with even the extreme remoteness of location proving no barrier to its relentless progression as it reaches far-flung locations such as Papua New Guinea and Timor-Leste. After declaring the event a global pandemic, Dr. Tedros Adhanom Ghebreyesus, WHO director general, said: “We have never before seen a pandemic sparked by a coronavirus. This is the first pandemic caused by a coronavirus. And we have never before seen a pandemic that can be controlled. … This is not just a public health crisis, it is a crisis that will touch every sector — so every sector and every individual must be involved in the fight.” Ignoring the Near Misses COVID-19 has been described as the biggest global catastrophe since World War II. Its impact on every part of our lives, from the mundane to the complex, will be profound, and its ramifications will be far-reaching and enduring. On multiple levels, the coronavirus has caught the world off guard. So rapidly has it spread that initial response strategies, designed to slow its progress, were quickly reevaluated and more restrictive measures have been required to stem the tide. Yet, some are asking why many nations have been so flat-footed in their response. To find a comparable pandemic event, it is necessary to look back over 100 years to the 1918 flu pandemic, also referred to as Spanish flu. While this is a considerable time gap, the interim period has witnessed multiple near misses that should have ensured countries remained primed for a potential pandemic. “For very good reasons, people are categorizing COVID-19 as a game-changer. However, SARS in 2003 should have been a game-changer, MERS in 2012 should have been a game-changer, Ebola in 2014 should have been a game-changer. If you look back over the last decade alone, we have seen multiple near misses.” Dr. Gordon Woo RMS However, as Dr. Gordon Woo, catastrophist at RMS, explains, such events have gone largely ignored. “For very good reasons, people are categorizing COVID-19 as a game-changer. However, SARS in 2003 should have been a game-changer, MERS in 2012 should have been a game-changer, Ebola in 2014 should have been a game-changer. If you look back over the last decade alone, we have seen multiple near misses. “If you examine MERS, this had a mortality rate of approximately 30 percent — much greater than COVID-19 — yet fortunately it was not a highly transmissible virus. However, in South Korea a mutation saw its transmissibility rate surge to four chains of infection, which is why it had such a considerable impact on the country.” While COVID-19 is caused by a novel virus and there is no preexisting immunity within the population, its genetic makeup shares 80 percent of the coronavirus genes that sparked the 2003 SARS outbreak. In fact, the virus is officially titled “severe acute respiratory syndrome coronavirus 2,” or “SARS-CoV-2.” However, the WHO refers to it by the name of the disease it causes, COVID-19, as calling it SARS could have “unintended consequences in terms of creating unnecessary fear for some populations, especially in Asia which was worst affected by the SARS outbreak in 2003.” “Unfortunately, people do not respond to near misses,” Woo adds, “they only respond to events. And perhaps that is why we are where we are with this pandemic. The current event is well within the bounds of catastrophe modeling, or potentially a lot worse if the fatality ratio was in line with that of the SARS outbreak. “When it comes to infectious diseases, we must learn from history. So, if we take SARS, rather than describing it as a unique event, we need to consider all the possible variants that could occur to ensure we are better able to forecast the type of event we are experiencing now.” Within Model Parameters A COVID-19-type event scenario is well within risk model parameters. The RMS® Infectious Diseases Model within its LifeRisks®platform incorporates a range of possible source infections, which includes coronavirus, and the company has been applying model analytics to forecast the potential development tracks of the current outbreak. Launched in 2007, the Infectious Diseases Model was developed in response to the H5N1 virus. This pathogen exhibited a mortality rate of approximately 60 percent, triggering alarm bells across the life insurance sector and sparking demand for a means of modeling its potential portfolio impact. The model was designed to produce outputs specific to mortality and morbidity losses resulting from a major outbreak. In 2006, H5N1 exhibited a mortality rate of approximately 60 percent, triggering alarm bells across the life insurance sector and sparking demand for a means of modeling its potential portfolio impact The probabilistic model is built on two critical pillars. The first is modeling that accurately reflects both the science of infectious disease and the fundamental principles of epidemiology. The second is a software platform that allows firms to address questions based on their exposure and experience data. “It uses pathogen characteristics that include transmissibility and virulence to compartmentalize a pathological epidemiological model and estimate an abated mortality and morbidity rate for the outbreak,” explains Dr. Brice Jabo, medical epidemiologist at RMS. “The next stage is to apply factors including demographics, vaccines and pharmaceutical and non-pharmaceutical interventions to the estimated rate. And finally, we adjust the results to reflect the specific differences in the overall health of the portfolio or the country to generate an accurate estimate of the potential morbidity and mortality losses.” The model currently spans 59 countries, allowing for differences in government strategy, health care systems, vaccine treatment, demographics and population health to be applied to each territory when estimating pandemic morbidity and mortality losses. Breaking Down the Virus In the case of COVID-19, transmissibility — the average number of infections that result from an initial case — has been a critical model parameter. The virus has a relatively high level of transmissibility, with data showing that the average infection rate is in the region of 1.5-3.5 per initial infection. However, while there is general consensus on this figure, establishing an estimate for the virus severity or virulence is more challenging, as Jabo explains: “Understanding the virulence of the disease enables you to assess the potential burden placed on the health care system. In the model, we therefore track the proportion of mild, severe, critical and fatal cases to establish whether the system will be able to cope with the outbreak. However, the challenge factor is that this figure is very dependent on the number of tests that are carried out in the particular country, as well as the eligibility criteria applied to conducting the tests.” An effective way of generating more concrete numbers is to have a closed system, where everyone in a particular environment has a similar chance of contracting the disease and all individuals are tested. In the case of COVID-19 these closed systems have come in the form of cruise ships. In these contained environments, it has been possible to test all parties and track the infection and fatality rates accurately. Another parameter tracked in the model is non-pharmaceutical intervention — those measures introduced in the absence of a vaccine to slow the progression of the disease and prevent health care systems from being overwhelmed. Suppression strategies are currently the most effective form of defense in the case of COVID-19. They are likely to be in place in many countries for a number of months as work continues on a vaccine. “This is an example of a risk that is hugely dependent on government policy for how it develops,” says Woo. “In the case of China, we have seen how the stringent policies they introduced have worked to contain the first wave, as well as the actions taken in South Korea. There has been concerted effort across many parts of Southeast Asia, a region prone to infectious diseases, to carry out extensive testing, chase contacts and implement quarantine procedures, and these have so far proved successful in reducing the spread. The focus is now on other parts of the world such as Europe and the Americas as they implement measures to tackle the outbreak.” The Infectious Diseases Model’s vaccine and pharmaceutical modifiers reflect improvements in vaccine production capacity, manufacturing techniques and the potential impact of antibacterial resistance. While an effective treatment is, at time of writing, still in development, this does allow users to conduct “what-if” scenarios. “Model users can apply vaccine-related assumptions that they feel comfortable with,” Jabo says. “For example, they can predict potential losses based on a vaccine being available within two months that has an 80 percent effectiveness rate, or an antiviral treatment available in one month with a 60 percent rate.” Data Upgrades Various pathogens have different mortality and morbidity distributions. In the case of COVID-19, evidence to date suggests that the highest levels of mortality from the virus occur in the 60-plus age range, with fatality levels declining significantly below this point. However, recent advances in data relating to immunity levels has greatly increased our understanding of the specific age range exposed to a particular virus. “Recent scientific findings from data arising from two major flu viruses, H5N1 and A/H7N9, have had a significant impact on our understanding of vulnerability,” explains Woo. “The studies have revealed that the primary age range of vulnerability to a flu virus is dependent upon the first flu that you were exposed to as a child. “There are two major flu groups to which everyone would have had some level of exposure at some stage in their childhood. That exposure would depend on which flu virus was dominant at the time they were born, influencing their level of immunity and which type of virus they are more susceptible to in the future. This is critical information in understanding virus spread and we have adapted the age profile vulnerability component of our model to reflect this.” Recent model upgrades have also allowed for the application of detailed information on population health, as Jabo explains: “Preexisting conditions can increase the risk of infection and death, as COVID-19 is demonstrating. Our model includes a parameter that accounts for the underlying health of the population at the country, state or portfolio level. “The information to date shows that people with co-morbidities such as hypertension, diabetes and cardiovascular disease are at a higher risk of death from COVID-19. It is possible, based on this data, to apply the distribution of these co-morbidities to a particular geography or portfolio, adjusting the outputs based on where our data shows high levels of these conditions.” Predictive Analytics The RMS Infectious Diseases Model is designed to estimate pandemic loss for a 12-month period. However, to enable users to assess the potential impact of the current pandemic in real time, RMS has developed a hybrid version that combines the model pandemic scenarios with the number of cases reported. “Using the daily cases numbers issued by each country,” says Jabo, “we project forward from that data, while simultaneously projecting backward from the RMS scenarios. Using this hybrid approach, it allows us to provide a time-dependent estimate for COVID-19. In effect, we are creating a holistic alignment of observed data coupled with RMS data to provide our clients with a way to understand how the evolution of the pandemic is progressing in real time.” Aligning the observed data with the model parameters makes the selection of proper model scenarios more plausible. The forward and backward projections, as illustrated, not only allow for short-term projections, but also forms part of model validation and enables users to derive predictive analytics to support their portfolio analysis. “Staying up to date with this dynamic event is vital,” Jabo concludes, “because the impact of the myriad government policies and measures in place will result in different potential scenarios, and that is exactly what we are seeing happening.”

A Need for Multi-Gap Analysis
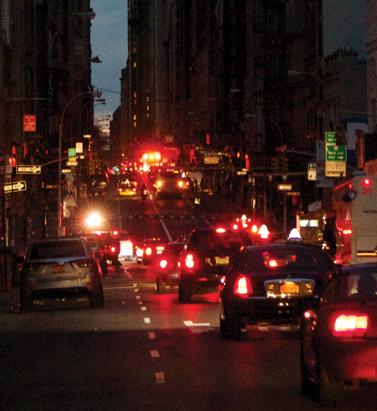
The insurance protection gap is composed of emerging markets and high-risk and intangible exposures There cannot be many industries that recognize that approximately 70 percent of market potential is untapped. Yet that is the scale of opportunity in the expanding “protection gap”. Power outage in lower Manhattan, New York, after Hurricane Sandy While efforts are ongoing to plug the colossal shortage, any meaningful industry foray into this barren range must acknowledge that the gap is actually multiple gaps, believes Robert Muir-Wood, chief research officer at RMS. “It is composed of three distinct insurance gaps — high risk, emerging markets and intangibles — each with separate causes and distinct solutions. Treating it as one single challenge means we will never achieve the loss clarity to tackle the multiple underlying issues.” High-risk, high-value gaps exist in regions where potential loss magnitude outweighs the ability of the industry to refund post-catastrophe. High deductibles and exclusions reduce coverage appeal and stunt market growth. “Take California earthquake. The California Earthquake Authority (CEA) was launched in 1996 to tackle the coverage dilemma exposed by the Northridge disaster. Yet increased deductibles and new exclusions led to a 30 percent gap expansion. And while recent changes have seen purchase uptick, penetration is around 12-14 percent for California homeowners.” On the emerging market front, micro- and meso-insurance and sovereign risk transfer efforts to bridge the gap have achieved limited success. “The shortfall in emerging economies remains static at between 80 to 100 percent,” he states, “and it is not just a developing world issue, it’s clearly evident in mature markets like Italy.” “The protection gap is composed of three distinct insurance gaps — high risk, emerging markets and intangibles — each with separate causes and distinct solutions” Robert Muir-Wood RMS A further fast-expanding gap is intangible assets. “In 1975, physical assets accounted for 83 percent of the value of S&P 500 companies,” Muir-Wood points out. “By 2015, that figure was 16 percent, with 84 percent composed of intangible assets such as IP, client data, brand value and innovation potential.” While non-damage business interruption cover is evolving, expanding client demand for events such as power outage, cloud disruption and cyberbreach greatly outpace delivery. To start closing these gaps, Muir-Wood believes protection gap analytics are essential. “We have to first establish a consistent measurement for the difference between insured and total loss and split out ‘penetration’ and ‘coverage’ gaps. That gives us our baseline from which to set appropriate targets and monitor progress. “Probabilistic cat risk models will play a central role, particularly for the high-risk protection gap, where multiple region and peril-specific models already exist. However, for intangibles and emerging markets, where such models have yet to gain a strong foothold, focusing on scenario events might prove a more effective approach.” Variations in the gaps according to severity and geography of the catastrophe could be expressed in the form of an exceedance probability curve, showing how the percentage of uninsured risk varies by return period. “There should be standardization in measuring and reporting the gap,” he concludes. “This should include analyzing insured and economic loss based on probabilistic models, separating the effects of the penetration and coverage gaps, and identifying how gaps vary with annual probability and location.”

Severe Convective Storms: A New Peak Peril?
Severe convective storms (SCS) have driven U.S. insured catastrophe losses in recent years with both attritional and major single-event claims now rivaling an average hurricane season. EXPOSURE looks at why SCS losses are rising and asks how (re)insurers should be responding At the time of writing, 2019 was already shaping up to be another active season for U.S. severe convective storms (SCS), with at least eight tornadoes daily over a period of 12 consecutive days in May. It was the most May tornadoes since 2015, with no fewer than seven outbreaks of SCS across central and eastern parts of the U.S. According to data from the National Oceanic and Atmospheric Administration (NOAA), there were 555 preliminary tornado reports, more than double the average of 276 for the month in the period of 1991-2010. According to the current numbers, May 2019 produced the second-highest number of reported tornadoes for any month on record after April 2011, which broke multiple records in relation to SCS and tornado touchdowns. It continues a trend set over the past two decades, which has seen SCS losses increasing significantly and steadily. In 2018, losses amounted to US$18.8 billion, of which US$14.1 billion was insured. This compares to insurance losses of US$15.6 billion for hurricane losses in the same period. While losses from SCS are often the buildup of losses from multiple events, there are examples of single events costing insurers and reinsurers over US$3 billion in claims. This includes the costliest SCS to date, which hit Tuscaloosa, Alabama, in April 2011, involving several tornado touchdowns and causing US$7.9 billion in insured damage. The second-most-costly SCS occurred in May of the same year, striking Joplin, Missouri, and other locations, resulting in insured losses of nearly US$7.6 billion. “The trend in the scientific discussion is that there might be fewer but more-severe events” Juergen Grieser RMS According to RMS models, average losses from SCS now exceed US$15 billion annually and are in the same range as hurricane average annual loss (AAL), which is also backed up by independently published scientific research. “The losses in 2011 and 2012 were real eye-openers,” says Rajkiran Vojjala, vice president of modeling at RMS. “SCS is no longer a peril with events that cost a few hundred million dollars. You could have cat losses of US$10 billion in today’s money if there were events similar to those in April 2011.” Nearly a third of all average annual reported tornadoes occur in the states of Texas, Oklahoma, Kansas and Nebraska, all states that are within the “Tornado Alley.” This is where cold, dry polar air meets warm, moist air moving up from the Gulf of Mexico, causing strong convective activity. “A typical SCS swath affects many states. So the extent is large, unlike, say, wildfire, which is truly localized to a small particular region,” says Vojjala. Research suggests the annual number of Enhanced Fujita (EF) scale EF2 and stronger tornadoes hitting the U.S. has trended upward over the past 20 years; however, there is some doubt over whether this is a real meteorological trend. One explanation could be that increased observational practices simply mean that such weather phenomena are more likely to be recorded, particularly in less populated regions. According to Juergen Grieser, senior director of modeling at RMS, there is a debate whether part of the increase in claims relating to SCS could be attributed to climate change. “A warmer climate means a weaker jet stream, which should lead to less organized convection while the energy of convection might increase,” he says. “The trend in the scientific discussion is that there might be fewer but more-severe events.” Claims severity rather than claims frequency is a more significant driver of losses relating to hail events, he adds. “We have an increase in hail losses of about 11 percent per year over the last 15 years, which is quite a lot. But 7.5 percent of that is from an increase in the cost of individual claims,” explains Grieser. “So, while the claims frequency has also increased in this period, the individual claim is more expensive now than it was ever before.” Claims go ‘Through the Roof’ Another big driver of loss is likely to be aging roofs and the increasing exposure at risk of SCS. The contribution of roof age was explored in a blog last year by Stephen Cusack, director of model development at RMS. He noted that one of the biggest changes in residential exposure to SCS over the past two decades has been the rise in the median age of housing from 30 years in 2001 to 37 years in 2013. A changing insurance industry climate is also a driver for increased losses, thinks Vojjala. “There has been a change in public perception on claiming whereby even cosmetic damage to roofs is now being claimed and contractors are chasing hailstorms to see what damage might have been caused,” he says. “So, there is more awareness and that has led to higher losses. “The insurance products for hail and tornado have grown and so those perils are being insured more, and there are different types of coverage,” he notes. “Most insurers now offer not replacement cost but only the actual value of the roofs to alleviate some of the rising cost of claims. On the flip side, if they do continue offering full replacement coverage and a hurricane hits in some of those areas, you now have better roofs.” How insurance companies approach the peril is changing as a result of rising claims. “Historically, insurance and reinsurance clients have viewed SCS as an attritional loss, but in the last five to 10 years the changing trends have altered that perception,” says Vojjala. “That’s where there is this need for high-resolution modeling, which increasingly our clients have been asking for to improve their exposure management practices. “With SCS also having catastrophic losses, it has stoked interest from the ILS community as well, who are also experimenting with parametric triggers for SCS,” he adds. “We usually see this on the earthquake or hurricane side, but increasingly we are seeing it with SCS as well.”
Ridgecrest: A Wake-Up Call
Marleen Nyst and Nilesh Shome of RMS explore some of the lessons and implications from the recent sequence of earthquakes in California On the morning of July 4, 2019, the small town of Ridgecrest in California’s Mojave Desert unexpectedly found itself at the center of a major news story after a magnitude 6.4 earthquake occurred close by. This earthquake later transpired to be a foreshock for a magnitude 7.1 earthquake the following day, the strongest earthquake to hit the state for 20 years. These events, part of a series of earthquakes and aftershocks that were felt by millions of people across the state, briefly reignited awareness of the threat posed by earthquakes in California. Fortunately, damage from the Ridgecrest earthquake sequence was relatively limited. With the event not causing a widespread social or economic impact, its passage through the news agenda was relatively swift. But there are several reasons why an event such as the Ridgecrest earthquake sequence should be a focus of attention both for the insurance industry and the residents and local authorities in California. “If Ridgecrest had happened in a more densely populated area, this state would be facing a far different economic future than it is today” Glenn Pomeroy California Earthquake Authority “We don’t want to minimize the experiences of those whose homes or property were damaged or who were injured when these two powerful earthquakes struck, because for them these earthquakes will have a lasting impact, and they face some difficult days ahead,” explains Glenn Pomeroy, chief executive of the California Earthquake Authority. “However, if this series of earthquakes had happened in a more densely populated area or an area with thousands of very old, vulnerable homes, such as Los Angeles or the San Francisco Bay Area, this state would be facing a far different economic future than it is today — potentially a massive financial crisis,” Pomeroy says. Although one of the most populous U.S. states, California’s population is mostly concentrated in metropolitan areas. A major earthquake in one of these areas could have repercussions for both the domestic and international economy. Low Probability, High Impact Earthquake is a low probability, high impact peril. In California, earthquake risk awareness is low, both within the general public and many (re)insurers. The peril has not caused a major insured loss for 25 years, the last being the magnitude 6.7 Northridge earthquake in 1994. California earthquake has the potential to cause large-scale insured and economic damage. A repeat of the Northridge event would likely cost the insurance industry today around US$30 billion, according to the latest version of the RMS® North America Earthquake Models, and Northridge is far from a worst-case scenario. From an insurance perspective, one of the most significant earthquake events on record would be the magnitude 9.0 Tōhoku Earthquake and Tsunami in 2011. For California, the 1906 magnitude 7.8 San Francisco earthquake, when Lloyd’s underwriter Cuthbert Heath famously instructed his San Franciscan agent to “pay all of our policyholders in full, irrespective of the terms of their policies”, remains historically significant. Heath’s actions led to a Lloyd’s payout of around US$50 million at the time and helped cement Lloyd’s reputation in the U.S. market. RMS models suggest a repeat of this event today could cost the insurance industry around US$50 billion. But the economic cost of such an event could be around six times the insurance bill — as much as US$300 billion — even before considering damage to infrastructure and government buildings, due to the surprisingly low penetration of earthquake insurance in the state. Events such as the 1906 earthquake and even Northridge are too far in the past to remain in public consciousness. And the lack of awareness of the peril’s damage potential is demonstrated by the low take-up of earthquake insurance in the state. “Because large, damaging earthquakes don’t happen very frequently, and we never know when they will happen, for many people it’s out of sight, out of mind. They simply think it won’t happen to them,” Pomeroy says. Across California, an average of just 12 percent to 14 percent of homeowners have earthquake insurance. Take-up varies across the state, with some high-risk regions, such as the San Francisco Bay Area, experiencing take-up below the state average. Take-up tends to be slightly higher in Southern California and is around 20 percent in Los Angeles and Orange counties. Take-up will typically increase in the aftermath of an event as public awareness rises but will rapidly fall as the risk fades from memory. As with any low probability, high impact event, there is a danger the public will not be well prepared when a major event strikes. The insurance industry can take steps to address this challenge, particularly through working to increase awareness of earthquake risk and actively promoting the importance of having insurance coverage for faster recovery. RMS and its insurance partners have also been working to improve society’s resilience against risks such as earthquake, through initiatives such as the 100 Resilient Cities program. Understanding the Risk While the tools to model and understand earthquake risk are improving all the time, there remain several unknowns which underwriters should be aware of. One of the reasons the Ridgecrest Earthquake came as such a surprise was that the fault on which it occurred was not one that seismologists knew existed. Several other recent earthquakes — such as the 2014 Napa event, the Landers and Big Bear Earthquakes in 1992, and the Loma Prieta Earthquake in 1989 — took place on previously unknown or thought to be inactive faults or fault strands. As well as not having a full picture of where the faults may lie, scientific understanding of how multifaults can link together to form a larger event is also changing. Events such as the Kaikoura Earthquake in New Zealand in 2016 and the Baja California Earthquake in Mexico in 2010 have helped inform new scientific thinking that faults can link together causing more damaging, larger magnitude earthquakes. The RMS North America Earthquake Models have also evolved to factor in this thinking and have captured multifault ruptures in the model based on the latest research results. In addition, studying the interaction between the faults that ruptured in the Ridgecrest events will allow RMS to improve the fault connectivity in the models. A further learning from New Zealand came via the 2011 Christchurch Earthquake, which demonstrated how liquefaction of soil can be a significant loss driver due to soil condition in certain areas. The San Francisco Bay Area, an important national and international economic hub, could suffer a similar impact in the event of a major earthquake. Across the area, there has been significant residential and commercial development on artificial landfill areas over the last 100 years, which are prone to have significant liquefaction damage, similar to what was observed in Christchurch. Location, Location, Location Clearly, the location of the earthquake is critical to the scale of damage and insured and economic impact from an event. Ridgecrest is situated roughly 200 kilometers north of Los Angeles. Had the recent earthquake sequence occurred beneath Los Angeles instead, then it is plausible that the insured cost could have been in excess of US$100 billion. The Puente Hills Fault, which sits underneath downtown LA, wasn’t discovered until around the turn of the century. A magnitude 6.8 Puente Hills event could cause an insured loss of US$78.6 billion, and a Newport-Inglewood magnitude 7.3 would cost an estimated US$77.1 billion according to RMS modeling. These are just a couple of the examples within its stochastic event set with a similar magnitude to the Ridgecrest events and which could have a significant social, economic and insured loss impact if they took place elsewhere in the state. The RMS model estimates that magnitude 7 earthquakes in California could cause insurance industry losses ranging from US$20,000 to a US$20 billion, but the maximum loss could be over US$100 billion if occurring in high population centers such as Los Angeles. The losses from the Ridgecrest event were on the low side of the range of loss as the event occurred in a less populated area. For the California Earthquake Authority’s portfolio in Los Angeles County, a large loss event of US$10 billion or greater can be expected approximately every 30 years. As with any major catastrophe, several factors can drive up the insured loss bill, including post-event loss amplification and contingent business interruption, given the potential scale of disruption. In Sacramento, there is also a risk of failure of the levee system. Fire following earthquake was a significant cause of damage following the 1906 San Francisco Earthquake and was estimated to account for around 40 percent of the overall loss from that event. It is, however, expected that fire would make a much smaller contribution to future events, given modern construction materials and methods and fire suppressant systems. Political pressure to settle claims could also drive up the loss total from the event. Lawmakers could put pressure on the CEA and other insurers to settle claims quickly, as has been the case in the aftermath of other catastrophes, such as Hurricane Sandy. The California Earthquake Authority has recommended homes built prior to 1980 be seismically retrofitted to make them less vulnerable to earthquake damage. “We all need to learn the lesson of Ridgecrest: California needs to be better prepared for the next big earthquake because it’s sure to come,” Pomeroy says. “We recommend people consider earthquake insurance to protect themselves financially,” he continues. “The government’s not going to come in and rebuild everybody’s home, and a regular residential insurance policy does not cover earthquake damage. The only way to be covered for earthquake damage is to have an additional earthquake insurance policy in place. “Close to 90 percent of the state does not have an earthquake insurance policy in place. Let this be the wake-up call that we all need to get prepared.”


Like Moths to the Flame
Why is it that, in many different situations and perils, people appear to want to relocate toward the risk? What is the role of the private insurance and reinsurance industry in curbing their clients’ risk tropism? Florida showed rapid percentage growth in terms of exposure and number of policyholders If the Great Miami Hurricane of 1926 were to occur again today it would result in insurance losses approaching US$200 billion. Even adjusted for inflation, that is hundreds of times more than the US$100 million damage toll in 1926. Over the past 100 years, the Florida coast has developed exponentially, with wealthy individuals drawn to buying lavish coastal properties — and the accompanying wind and storm-surge risks. Since 2000, the number of people living in coastal areas of Florida increased by 4.2 million, or 27 percent, to 19.8 million in 2015, according to the U.S. Census Bureau. This is an example of unintended “risk tropism,” explains Robert Muir-Wood, chief research officer at RMS. Just as the sunflower is a ‘heliotrope’, turning toward the sun, research has shown how humans have an innate drive to live near water, on a river or at the beach, often at increased risk of flood hazards. “There is a very strong human desire to find the perfect primal location for your house. It is something that is built deeply into the human psyche,” Muir-Wood explains. “People want to live with the sound of the sea, or in the forest ‘close to nature,’ and they are drawn to these locations thinking about all the positives and amenity values, but not really understanding or evaluating the accompanying risk factors. “People will pay a lot to live right next to the ocean,” he adds. “It’s an incredibly powerful force and they will invest in doing that, so the price of land goes up by a factor of two or three times when you get close to the beach.” Even when beachfront properties are wiped out in hurricane catastrophes, far from driving individuals away from a high-risk zone, research shows they simply “build back bigger,” says Muir-Wood. “The disaster can provide the opportunity to start again, and wealthier people move in and take the opportunity to rebuild grander houses. At least the new houses are more likely to be built to code, so maybe the reduction in vulnerability partly offsets the increased exposure at risk.” Risk tropism can also be found with the encroachment of high-value properties into the wildlands of California, leading to a big increase in wildfire insurance losses. Living close to trees can be good for mental health until those same trees bring a conflagration. Insurance losses due to wildfire exceeded US$10 billion in 2017 and have already breached US$12 billion for last year’s Camp, Hill and Woolsey Fires, according to the California Department of Insurance. It is not the number of fires that have increased, but the number of houses consumed by the fires. “Insurance tends to stop working when you have levels of risk above one percent […] People are unprepared to pay for it” Robert Muir-Wood RMS Muir-Wood notes that the footprint of the 2017 Tubbs Fire, with claims reaching to nearly US$10 billion, was very similar to the area burned during the Hanley Fire of 1964. The principal difference in outcome is driven by how much housing has been developed in the path of the fire. “If a fire like that arrives twice in one hundred years to destroy your house, then the amount you are going to have to pay in insurance premium is going to be more than 2 percent of the value per year,” he says. “People will think that’s unjustified and will resist it, but actually insurance tends to stop working when you have levels of risk cost above 1 percent of the property value, meaning, quite simply, that people are unprepared to pay for it.” Risk tropism can also be found in the business sector, in the way that technology companies have clustered in Silicon Valley: a tectonic rift within a fast-moving tectonic plate boundary. The tectonics have created the San Francisco Bay and modulate the climate to bring natural air-conditioning. “Why is it that, around the world, the technology sector has picked locations — including Silicon Valley, Seattle, Japan and Taiwan — that are on plate boundaries and are earthquake prone?” asks Muir-Wood. “There seems to be some ideal mix of mountains and water. The Bay Area is a very attractive environment, which has brought the best students to the universities and has helped companies attract some of the smartest people to come and live and work in Silicon Valley,” he continues. “But one day there will be a magnitude 7+ earthquake in the Bay Area that will bring incredible disruption, that will affect the technology firms themselves.” Insurance and reinsurance companies have an important role to play in informing and dissuading organizations and high net worth individuals from being drawn toward highly exposed locations; they can help by pricing the risk correctly and maintaining underwriting discipline. The difficulty comes when politics and insurance collide. The growth of Fair Access to Insurance Requirements (FAIR) plans and beach plans, offering more affordable insurance in parts of the U.S. that are highly exposed to wind and quake perils, is one example of how this function is undermined. At its peak, the size of the residual market in hurricane-exposed states was US$885 billion, according to the Insurance Information Institute (III). It has steadily been reduced, partly as a result of the influx of non-traditional capacity from the ILS market and competitive pricing in the general reinsurance market. However, in many cases the markets-of-last-resort remain some of the largest property insurers in coastal states. Between 2005 and 2009 (following Hurricanes Charley, Frances, Ivan and Jeanne in 2004), the plans in Mississippi, Texas and Florida showed rapid percentage growth in terms of exposure and number of policyholders. A factor fueling this growth, according to the III, was the rise in coastal properties. As long as state-backed insurers are willing to subsidize the cost of cover for those choosing to locate in the riskiest locations, private (re)insurance will fail as an effective check on risk tropism, thinks Muir-Wood. “In California there are quite a few properties that have not been able to get standard fire insurance,” he observes. “But there are state or government-backed schemes available, and they are being used by people whose wildfire risk is considered to be too high.”


Shaking Up Workers' Compensation
Are (re)insurers sufficiently capitalized to withstand a major earthquake in a metropolitan area during peak hours? The U.S. workers’ compensation insurance market continues to generate underwriting profit. According to Fitch Ratings, 2019 is on track to mark the fifth consecutive year of profits and deliver a statutory combined ratio of 86 percent in 2018. Since 2015, it has achieved an annual average combined ratio of 93 percent. The market’s size has increased considerably since the 2008 financial crisis sparked a flurry of activity in the workers’ compensation arena. Over the last 10 years, written premiums have risen 50 percent from approximately US$40 billion to almost US$60 billion, aided by low unemployment and growth in rate and wages. Yet market conditions are changing. The pricing environment is deteriorating, prior-year reserve releases are slowing and severity is ticking upwards. And while loss reserves currently top US$150 billion, questions remain over whether these are sufficient to bear the brunt of a major earthquake in a highly populated area. The Big One California represents over 20 percent of the U.S. workers’ compensation market. The Workers’ Compensation Insurance Rating Bureau of California (WCIRB) forecasts a written premium pot of US$15.7 billion for 2019, a slight decline on 2018’s US$17 billion figure. “So, the workers’ compensation sector’s largest premium is concentrated in the area of the U.S. most exposed to earthquake risk,” explains Nilesh Shome, vice president at RMS. “This problem is unique to the U.S., since in most other countries occupational injury is covered by government insurance schemes instead of the private market. Further, workers’ compensation policies have no limits, so they can be severely impacted by a large earthquake.” Workers’ compensation insurers enjoy relatively healthy balance sheets, with adequate profitability and conservative premium-to-surplus ratios. But, when you assess the industry’s exposure to large earthquakes in more detail, the surplus base starts to look a little smaller. “We are also talking about a marketplace untested in modern times,” he continues. “The 1994 Northridge Earthquake in Los Angeles, for example, while causing major loss, occurred at 4:30 a.m. when most people were still in bed, so had limited impact from a workers’ compensation perspective.” Analyzing the Numbers Working with the WCIRB, RMS modeled earthquake scenarios using Version 17 of the RMS® North America Earthquake Casualty Model, which incorporates the latest science in earthquake hazard and vulnerability research. The portfolio provided by the WCIRB contained exposure information for 11 million full-time-equivalent employees, including occupation details for each. The analysis showed that the average annual estimated insured loss is US$29 million, which corresponds to 0.5 cents per $100 payroll and $2.50 per employee. The 1-in-100-year insurance loss is expected to exceed US$300 million, around 5,000 casualties including 300 fatalities; while at peak work-time hours, the loss could rise to US$1.5 billion. For a 1-in-250-year loss, the figure could top US$1.4 billion and more than 1,000 fatalities, rising to US$5 billion at peak work-time hours. But looking at the magnitude 7.8 San Francisco Earthquake in 1906 at 5:12 a.m., the figure would be 7,300 injuries, 1,900 fatalities and around US$1 billion in loss. At peak work hours, this would rise to 22,000 casualties, 5,800 fatalities and a US$3 billion loss. To help reduce the impact of major earthquakes, RMS is working with the Berkeley Research Lab and the United States Geological Survey (USGS) to research the benefits of an earthquake early warning system (EEWS) and safety measures such as drop-cover-hold and evacuating buildings after an EEWS alarm. Initial studies indicate that an EEWS alert for the large, faraway earthquakes such as the 1857 magnitude 7.9 Fort Tejon Earthquake near Los Angeles can reduce injuries by 20 percent-50 percent. Shome concludes: “It is well known in the industry that workers’ compensation loss distribution has a long tail, and at conferences RMS has demonstrated how our modeling best captures this tail. The model considers many low probability, high consequence events by accurately modeling the latest USGS findings.”
