


EXPOSURE
The RMS Magazine with a unique perspective and clear mission “... to provide insight and analysis to help insurance and risk professionals innovate, adapt, and deliver.”
Insurance: The next 10 years
Mohsen Rahnama, Cihan Biyikoglu and Moe Khosravy of RMS look to 2029, consider the…
Times Square, New York City
Reset Filters
Perils
- 2022
- 2021
- 2020
- 2019
- 2018
- 2017
- 2016


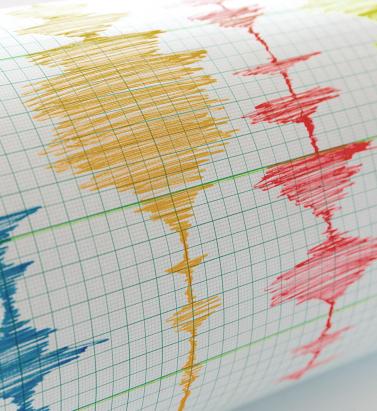
The Peril of Ignoring The Tail
Drawing on several new data sources and gaining a number of new insights from recent earthquakes on how different fault segments might interact in future earthquakes, Version 17 of the RMS North America Earthquake Models sees the frequency of larger events increasing, making for a fatter tail. EXPOSURE asks what this means for (re)insurers from a pricing and exposure management perspective. Recent major earthquakes, including the M9.0 Tohoku Earthquake in Japan in 2011 and the Canterbury Earthquake Sequence in New Zealand (2010-2011), have offered new insight into the complexities and interdependencies of losses that occur following major events. This insight, as well as other data sources, was incorporated into the latest seismic hazard maps released by the U.S. Geological Survey (USGS). In addition to engaging with USGS on its 2014 update, RMS went on to invest more than 100 person-years of work in implementing the main findings of this update as well as comprehensively enhancing and updating all components in its North America Earthquake Models (NAEQ). The update reflects the deep complexities inherent in the USGS model and confirms the adage that “earthquake is the quintessential tail risk.” Among the changes to the RMS NAEQ models was the recognition that some faults can interconnect, creating correlations of risk that were not previously appreciated. Lessons from Kaikoura While there is still a lot of uncertainty surrounding tail risk, the new data sets provided by USGS and others have improved the understanding of events with a longer return period. “Global earthquakes are happening all of the time, not all large, not all in areas with high exposures,” explains Renee Lee, director, product management at RMS. “Instrumentation has become more advanced and coverage has expanded such that scientists now know more about earthquakes than they did eight years ago when NAEQ was last released in Version 9.0.” This includes understanding about how faults creep and release energy, how faults can interconnect, and how ground motions attenuate through soil layers and over large distances. “Soil plays a very important role in the earthquake risk modeling picture,” says Lee. “Soil deposits can amplify ground motions, which can potentially magnify the building’s response leading to severe damage.” The 2016 M7.8 earthquake in Kaikoura, on New Zealand’s South Island, is a good example of a complex rupture where fault segments connected in more ways than had previously been realized. In Kaikoura, at least six fault segments were involved, where the rupture “jumped” from one fault segment to the next, producing a single larger earthquake. “The Kaikoura quake was interesting in that we did have some complex energy release moving from fault to fault,” says Glenn Pomeroy, CEO of the California Earthquake Authority (CEA). “We can’t hide our heads in the sand and pretend that scientific awareness doesn’t exist. The probability has increased for a very large, but very infrequent, event, and we need to determine how to manage that risk.” San Andreas Correlations Looking at California, the updated models include events that extend from the north of San Francisco to the south of Palm Springs, correlating exposures along the length of the San Andreas fault. While the prospect of a major earthquake impacting both northern and southern California is considered extremely remote, it will nevertheless affect how reinsurers seek to diversify different types of quake risk within their book of business. “In the past, earthquake risk models have considered Los Angeles as being independent of San Francisco,” says Paul Nunn, head of catastrophe risk modeling at SCOR. “Now we have to consider that these cities could have losses at the same time (following a full rupture of the San Andreas Fault). In Kaikoura, at least six fault segments were involved, where the rupture “jumped” from one fault segment to the next “However, it doesn’t make that much difference in the sense that these events are so far out in the tail … and we’re not selling much coverage beyond the 1-in-500-year or 1-in-1,000-year return period. The programs we’ve sold will already have been exhausted long before you get to that level of severity.” While the contribution of tail events to return period losses is significant, as Nunn explains, this could be more of an issue for insurance companies than (re)insurers, from a capitalization standpoint. “From a primary insurance perspective, the bigger the magnitude and event footprint, the more separate claims you have to manage. So, part of the challenge is operational — in terms of mobilizing loss adjusters and claims handlers — but primary insurers also have the risk that losses from tail events could go beyond the (re)insurance program they have bought. “It’s less of a challenge from the perspective of global (re)insurers, because most of the risk we take is on a loss limited basis — we sell layers of coverage,” he continues. “Saying that, pricing for the top layers should always reflect the prospect of major events in the tail and the uncertainty associated with that.” He adds: “The magnitude of the Tohoku earthquake event is a good illustration of the inherent uncertainties in earthquake science and wasn’t represented in modeled scenarios at that time.” While U.S. regulation stipulates that carriers writing quake business should capitalize to the 1-in-200-year event level, in Canada capital requirements are more conservative in an effort to better account for tail risk. “So, Canadian insurance companies should have less overhang out of the top of their (re)insurance programs,” says Nunn. Need for Post-Event Funding For the CEA, the updated earthquake models could reinvigorate discussions around the need for a mechanism to raise additional claims-paying capacity following a major earthquake. Set up after the Northridge Earthquake in 1994, the CEA is a not-for-profit, publicly managed and privately funded earthquake pool. “It is pretty challenging for a stand-alone entity to take on large tail risk all by itself,” says Pomeroy. “We have, from time to time, looked at the possibility of creating some sort of post-event risk-transfer mechanism. “A few years ago, for instance, we had a proposal in front of the U.S. Congress that would have created the ability for the CEA to have done some post-event borrowing if we needed to pay for additional claims,” he continues. “It would have put the U.S. government in the position of guaranteeing our debt. The proposal didn’t get signed into law, but it is one example of how you could create an additional claim-paying capacity for that very large, very infrequent event.” “(Re)insurers will be considering how to adjust the balance between the LA and San Francisco business they’re writing” Paul Nunn SCOR The CEA leverages both traditional and non-traditional risk-transfer mechanisms. “Risk transfer is important. No one entity can take it on alone,” says Pomeroy. “Through risk transfer from insurer to (re)insurer the risk is spread broadly through the entrance of the capital markets as another source for claim-paying capability and another way of diversifying the concentration of the risk. “We manage our exposure very carefully by staying within our risk-transfer guidelines,” he continues. “When we look at spreading our risk, we look at spreading it through a large number of (re)insurance companies from 15 countries around the world. And we know the (re)insurers have their own strict guidelines on how big their California quake exposure should be.” The prospect of a higher frequency of larger events producing a “fatter” tail also raises the prospect of an overall reduction in average annual loss (AAL) for (re)insurance portfolios, a factor that is likely to add to pricing pressure as the industry approaches the key January 1 renewal date, predicts Nunn. “The AAL for Los Angeles coming down in the models will impact the industry in the sense that it will affect pricing and how much probable maximum loss people think they’ve got. Most carriers are busy digesting the changes and carrying out due diligence on the new model updates. “Although the eye-catching change is the possibility of the ‘big one,’ the bigger immediate impact on the industry is what’s happening at lower return periods where we’re selling a lot of coverage,” he says. “LA was a big driver of risk in the California quake portfolio and that’s coming down somewhat, while the risk in San Francisco is going up. So (re)insurers will be considering how to adjust the balance between the LA and San Francisco business they’re writing.”

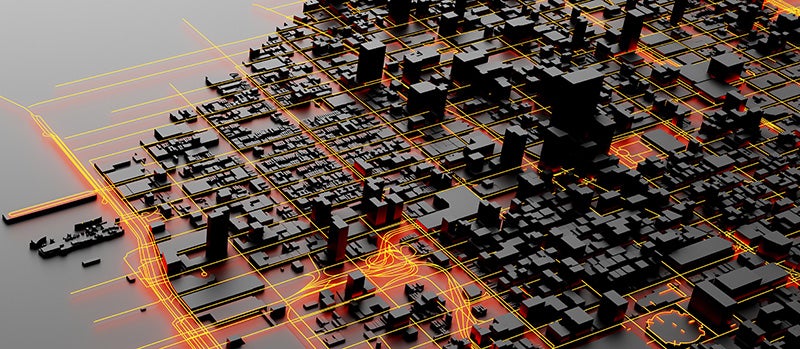
The Day a Botnet Took Down the Internet
The Dyn distributed denial of service (DDoS) attack in October 2016 highlighted security flaws inherent in the Internet of Things (IoT). EXPOSURE asks what this means for businesses and insurers as the world becomes increasingly connected. A decade ago, Internet connections were largely limited to desktop computers, laptops, tablets, and smart phones. Since then there has been an explosion of devices with IP addresses, including baby monitors, connected home appliances, motor vehicles, security cameras, webcams, ‘Fitbits’ and other wearables. Gartner predicts there will be 20.8 billion things connected to the Internet by 2020. In a hyper-connected world, governments, corporates, insurers and banks need to better understand the potential for systemic and catastrophic risk arising from a cyber attack seeking to exploit IoT vulnerabilities. With few actual examples of how such attacks could play out, realistic disaster scenarios and cyber modeling are essential tools by which (re)insurers can manage their aggregate exposures and stress test their portfolios. “IF MALICIOUS ACTORS WANTED TO, THEY WOULD ATTACK CORE SERVICES ON THE INTERNET AND I THINK WE’D BE SEEING A NEAR GLOBAL OUTAGE” KEN MUNRO PEN TEST PARTNERS Many IoT devices currently on the market were not designed with strict IT security in mind. Ethical hackers have demonstrated how everything from cars to children’s toys can be compromised. These connected devices are often an organization’s weakest link. The cyber criminals responsible for the 2013 Target data breach are understood to have gained access to the retailer’s systems and the credit card details of over 40 million customers via the organization’s heating, ventilation and air conditioning (HVAC) system. The assault on DNS hosting firm Dyn in October 2016, which brought down multiple websites including Twitter, Netflix, Amazon, Spotify, Reddit, and CNN in Europe and the U.S., was another wake-up call. The DDoS attack was perpetrated using the Mirai virus to compromise IoT systems. Like a parasite, the malware gained control of an estimated 100,000 devices, using them to bombard and overwhelm Dyn’s infrastructure. This is just the tip of the iceberg, according to Ken Munro, partner, Pen Test Partners. “My first thought [following the Dyn attack] was ‘you ain’t seen nothing yet’. That particular incident was probably using the top end of a terabyte of data per second, and that’s nothing. We’ve already seen a botnet that is several orders of magnitude larger than that. If malicious actors wanted to, they would attack core services on the Internet and I think we’d be seeing a near global outage.” In the rush to bring new IoT devices to market, IT security has been somewhat of an afterthought, thinks Munro. The situation is starting to change, though, with consumer watchdogs in Norway, the Netherlands and the U.S. taking action. However, there is a significant legacy problem to overcome and it will be several years before current security weaknesses are tackled in a meaningful way. “I’ve still got our first baby monitor from 10 years ago,” he points out. “The Mirai botnet should have been impossible, but it wasn’t because a whole bunch of security camera manufacturers did a really cheap job. IT security wasn’t on their radar. They were thinking about keeping people’s homes secure without even considering that the device itself might actually be the problem.” In attempting to understand the future impact of such attacks, it is important to gain a better understanding of motivation. For cyber criminals, DDoS attacks using IoT botnets could be linked to extortion attempts or to diverting the attention of IT professionals away from other activities. For state-sponsored actors, the purpose could be more sinister, with the intent to cause widespread disruption, and potentially physical damage and bodily harm. Insurers Stress-Test “Silent” Cyber It is the latter scenario that is of growing concern to risk and insurance managers. Lloyd’s, for instance, has asked syndicates to create at least three internal “plausible but extreme” cyber attack scenarios as stress-tests for cyber catastrophe losses. It has asked them to calculate their total gross aggregate exposure to each scenario across all classes, including “silent” cyber. AIG is also considering how a major cyber attack could impact its book of business. “We are looking at it, not only from our own ERM perspective, but also to understand what probable maximum losses there could be as we start to introduce other products and are able to attach cyber to traditional property and casualty policies,” explains Mark Camillo, head of cyber at AIG. “We look at different types of scenarios and how they would impact a book.” AIG and a number of Lloyd’s insurers have expanded their cyber offerings to include cover for non-damage business interruption and physical damage and bodily harm arising from a cyber incident. Some carriers – including FM Global – are explicitly including cyber in their traditional suite of products. Others have yet to include explicit wording on how traditional products would respond to a cyber incident. “WE HAVE RELEASED A NUMBER OF CYBER-PHYSICAL ATTACK SCENARIOS THAT CAUSE LOSSES TO TRADITIONAL PROPERTY INSURANCE” ANDREW COBURN RMS “I don’t know if the market will move towards exclusions or including affirmative cyber coverage within property and casualty to give insureds a choice as to how they want to purchase it,” states Camillo. “What will change is that there is going to have to be some sort of due diligence to ensure cyber exposures are coded properly and carriers are taking that into consideration in capital requirements for these types of attacks.” In addition to markets such as Lloyd’s, there is growing scrutiny from insurance industry regulators, including the Prudential Regulation Authority in the U.K., on how a major cyber event could impact the insurance industry and its capital buffers. They are putting pressure on those carriers that are currently silent on how their traditional products would respond, to make it clear whether cyber-triggered events would be covered under conventional policies. “The reinsurance market is certainly concerned about, and constantly looking at the potential for, catastrophic events that could happen across a portfolio,” says William Henriques, senior managing director and co-head of the Cyber Practice Group at Aon Benfield. “That has not stopped them from writing cyber reinsurance and there’s enough capacity out there. But as the market grows and gets to US$10 billion, and reinsurers keep supporting that growth, they are going to be watching that accumulation and potential for catastrophic risk and managing that.” Catastrophic Cyber Scenarios In December 2015 and again in December 2016, parts of Ukraine’s power grid were taken down. WIRED magazine noted that many parts of the U.S. grid were less secure than Ukraine’s and would take longer to reboot. It was eerily similar to a fictitious scenario published by Cambridge University’s Centre for Risk Studies in partnership with Lloyd’s in 2015. ‘Business Blackout’ considered the impact of a cyber attack on the US power grid, estimating total economic impact from the 1-in-200 scenario would be US$243 billion, rising to US$1 trillion in its most extreme form. It is not beyond the realms of possibility for a Mirai-style virus targeting smart thermostats to be used to achieve such a blackout, thinks Pen Test Partners’ Ken Munro. “You could simultaneously turn them all on and off at the same time and create huge power spikes on the electricity grid. If you turn it on and off and on again quickly, you’ll knock out the grid – then we would see some really serious consequences.” Smart thermostats could be compromised in other ways, for instance by targeting food and pharmaceutical facilities with the aim to spoil goods. There is a commonly held belief that the industrial and supervisory control and data acquisition systems (ICS/SCADA) used by energy and utility companies are immune to cyber attacks because they are disconnected from the Internet, a protective measure known as “air gapping”. Smart thermostats and other connected devices could render that defense obsolete. In its Cyber Accumulation Management System (CAMS v2.0), RMS considered how silent cyber exposures could impact accumulation risk in the event of major cyber attacks on operations technology, using the Ukrainian power grid attack as an example. “We’ve released a number of cyber-physical attack scenarios that cause losses to traditional property insurance,” explains Andrew Coburn, senior vice president at RMS and a founder and member of the executive team of the Cambridge Centre for Risk Studies. “We’re working with our clients on trying to figure out what level of stress test should be running,” he explains. “The CAMS system we’ve released is about running large numbers of scenarios and we have extended that to look at silent cover, things in conventional insurance policies that could potentially be triggered by a cyber attack, such as fires and explosions.” Multiple lines of business could be impacted by a cyber event thinks Coburn, including nearly all property classes, including aviation and aerospace. “We have included some scenarios for marine and cargo insurance, offshore energy lines of business, industrial property, large numbers of general liability and professional lines, and, quite importantly, financial institutions professional indemnity, D&O and specialty lines.” “The IoT is a key element of the systemic potential of cyber attacks,” he says. “Most of the systemic risk is about looking at your tail risk. Insurers need to look at how much capital they need to support each line of business, how much reinsurance they need to buy and how they structure their risk capital.” RMS CAMS v2.0 Scenarios Cyber-Induced Fires in Commercial Office Buildings Hackers exploit vulnerabilities in the smart battery management system of a common brand of laptop, sending their lithium-ion batteries into thermal runaway state. The attack is coordinated to occur on one night. A small proportion of infected laptops that are left on charge overnight overheat and catch fire, and some unattended fires in commercial office buildings spread to cause major losses. Insurers face claims for a large numbers of fires in their commercial property and homeowners’ portfolios. Cyber-Enabled Marine Cargo Theft From Port Cyber criminals gain access to a port management system in use at several major ports. They identify high value cargo shipments and systematically switch and steal containers passing through the ports over many months. When the process of theft is finally discovered, the hackers scramble the data in the system, disabling the ports from operating for several days. Insurers face claims for cargo loss and business interruption in their marine lines. ICS-Triggered Fires in Industrial Processing Plants External saboteurs gain access to the process control network of large processing plants, and spoof the thermostats of the industrial control systems (ICS), causing heat-sensitive processes to overheat and ignite flammable materials in storage facilities. Insurers face sizeable claims for fire and explosions in a number of major industrial facilities in their large accounts and facultative portfolio. PCS-Triggered Explosions on Oil Rigs A disgruntled employee gains access to a Network Operations Centre (NOC) controlling a field of oil rigs, and manipulates several of the Platform Control Systems (PCS) to cause structural misalignment of well heads, damage to several rigs, oil and gas release, and fires. At least one platform has a catastrophic explosion. Insurers face significant claims to multiple production facilities in their offshore energy book. Regional Power Outage From Cyber Attack on U.S. Power Generation A well-resourced cyber team infiltrates malware into the control systems of U.S. power generating companies that creates desynchronization in certain types of generators. Sufficient generators are damaged to cause a cascading regional power outage that is complex to repair. Restoration of power to 90 percent of customers takes two weeks. Insurers face claims in many lines of business, including large commercial accounts, energy, homeowners and speciality lines. The scenario is published as a Lloyd’s Emerging Risk Report ‘Business Blackout’ by Cambridge Centre for Risk Studies and was released in RMS CAMS v1.1. Regional Power Outage From Cyber Attack on UK Power Distribution A nation-state plants ‘Trojan Horse’ rogue hardware in electricity distribution substations, which are activated remotely to curtail power distribution and cause rolling blackouts intermittently over a multi-week campaign. Insurers face claims in many lines of business, including large commercial accounts, energy, homeowners and specialty lines. The scenario is published as ‘Integrated Infrastructure’ by Cambridge Centre for Risk Studies, and was released in RMS CAMS v1.1.
An Unparalleled View of Earthquake Risk
As RMS launches Version 17 of its North America Earthquake Models, EXPOSURE looks at the developments leading to the update and how distilling immense stores of high-resolution seismic data into the industry’s most comprehensive earthquake models will empower firms to make better business decisions. The launch of RMS’ latest North America Earthquake Models marks a major step forward in the industry’s ability to accurately analyze and assess the impacts of these catastrophic events, enabling firms to write risk with greater confidence due to the underpinning of its rigorous science and engineering. The value of the models to firms seeking new ways to differentiate and diversify their portfolios as well as price risk more accurately, comes from a host of data and scientific updates. These include the incorporation of seismic source data from the U.S. Geological Survey (USGS) 2014 National Seismic Hazard Mapping Project. First groundwater map for Liquefaction “Our goal was to provide clients with a seamless view of seismic hazards across the U.S., Canada and Mexico that encapsulates the latest data and scientific thinking— and we’ve achieved that and more,” explains Renee Lee, head of earthquake model and data product management at RMS. “There have been multiple developments – research and event-driven – which have significantly enhanced understanding of earthquake hazards. It was therefore critical to factor these into our models to give our clients better precision and improved confidence in their pricing and underwriting decisions, and to meet the regulatory requirements that models must reflect the latest scientific understanding of seismic hazard.” Founded on Collaboration Since the last RMS model update in 2009, the industry has witnessed the two largest seismic-related loss events in history – the New Zealand Canterbury Earthquake Sequence (2010-2011) and the Tohoku Earthquake (2011). “We worked very closely with the local markets in each of these affected regions,” adds Lee, “collaborating with engineers and the scientific community, as well as sifting through billions of dollars of claims data, in an effort not only to understand the seismic behavior of these events, but also their direct impact on the industry itself.” A key learning from this work was the impact of catastrophic liquefaction. “We analyzed billions of dollars of claims data and reports to understand this phenomenon both in terms of the extent and severity of liquefaction and the different modes of failure caused to buildings,” says Justin Moresco, senior model product manager at RMS. “That insight enabled us to develop a high-resolution approach to model liquefaction that we have been able to introduce into our new North America Earthquake Models.” An important observation from the Canterbury Earthquake Sequence was the severity of liquefaction which varied over short distances. Two buildings, nearly side-by-side in some cases, experienced significantly different levels of hazard because of shifting geotechnical features. “Our more developed approach to modeling liquefaction captures this variation, but it’s just one of the areas where the new models can differentiate risk at a higher resolution,” said Moresco. The updated models also do a better job of capturing where soft soils are located, which is essential for predicting the hot spots of amplified earthquake shaking.” “There is no doubt that RMS embeds more scientific data into its models than any other commercial risk modeler,” Lee continues. “Throughout this development process, for example, we met regularly with USGS developers, having active discussions about the scientific decisions being made. In fact, our model development lead is on the agency’s National Seismic Hazard and Risk Assessment Steering Committee, while two members of our team are authors associated with the NGA-West 2 ground motion prediction equations.” The North America Earthquake Models in Numbers 360,000 Number of fault sources included in the UCERF3, the USGS California seismic source model >3,800 Number of unique U.S. vulnerability functions in RMS’ 2017 North America Earthquake Models for building shake coverage, with the ability to further differentiate risk based on 21 secondary building characteristics >30 Size of team at RMS that worked on updating the latest model Distilling the Data While data is the foundation of all models, the challenge is to distil it down to its most business-critical form to give it value to clients. “We are dealing with data sets spanning millions of events,” explains Lee, “for example, UCERF3 — the USGS California seismic source model — alone incorporates more than 360,000 fault sources. So, you have to condense that immense amount of data in such a way that it remains robust but our clients can run it within ‘business hours’.” Since the release of the USGS data in 2014, RMS has had over 30 scientists and engineers working on how to take data generated by a super computer once every five to six years and apply it to a model that enables clients to use it dynamically to support their risk assessment in a systematic way. “You need to grasp the complexities within the USGS model and how the data has evolved,” says Mohsen Rahnama, chief risk modeling officer and general manager of the RMS models and data business. “In the previous California seismic source model, for example, the USGS used 480 logic tree branches, while this time they use 1,440 logic trees. You can’t simply implement the data – you have to understand it. How do these faults interact? How does it impact ground motion attenuation? How can I model the risk systematically?” As part of this process, RMS maintained regular contact with USGS, keeping them informed of how they were implementing the data and what distillation had taken place to help validate their approach. Building Confidence Demonstrating its commitment to transparency, RMS also provides clients with access to its scientists and engineers to help them drill down in the changes into the model. Further, it is publishing comprehensive documentation on the methodologies and validation processes that underpin the new version. Expanding the Functionality Upgraded soil amplification methodology that empowers (re)insurers to enter a new era of high-resolution geotechnical hazard modeling, including the development of a Vs30 (average shear wave velocity in the top 30 meters at site) data layer spanning North America Advanced ground motion models leveraging thousands of historical earthquake recordings to accurately predict the attenuation of shaking from source to site New functionality enabling high and low representations of vulnerability and ground motion 3,800+ unique U.S. vulnerability functions for building shake coverage. Ability to further differentiate risk based on 21 secondary building characteristics Latest modeling for very tall buildings (>40 stories) enables more accurate underwriting of high-value assets New probabilistic liquefaction model leveraging data from the 2010-2011 Canterbury Earthquake Sequence in New Zealand Ability to evaluate secondary perils: tsunami, fire following earthquake and earthquake sprinkler leakage New risk calculation functionality based on an event set includes induced seismicity Updated basin model for Seattle, Mississippi Embayment, Mexico City and Los Angeles. Added a new basin model for Vancouver Latest historical earthquake catalog from the Geological Survey of Canada integrated, plus latest research data on the Mexico Subduction Zone Seismic source data from the U.S. Geological Survey (USGS) 2014 National Seismic Hazard Mapping Project incorporated, which includes the third Uniform California Earthquake Rupture Forecast (UCERF3) Updated Alaska and Hawaii hazard model, which was not updated by USGS
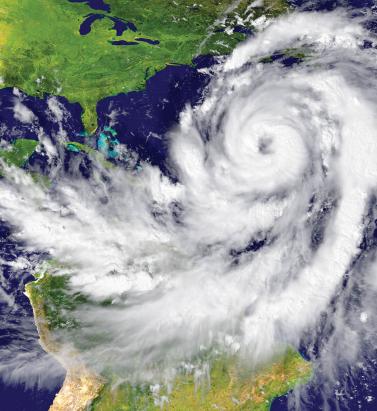

The Next Big One?
Rather than waiting for the next elusive hard market, successful (re)insurers are focusing on making informed underwriting decisions and taking well-calculated risks, according to Ben Brookes, managing director – capital and resilience solutions, RMS. A popular topic of conversation at the big industry gatherings is when the next “big one” will occur. What size and nature of loss could reverse the softening trend and see a return to hard market pricing? The influx of alternative capital into the reinsurance market over the past decade has transformed the traditional reinsurance cycle with no guarantee a market peak will follow the current trough. Insured catastrophe losses over the past few years have been significantly below average, particularly in comparison to major loss years such as 2005 and 2011. The majority of large-scale events during this time have resulted in a relatively low level of insurance claims due to the fact they have occurred in areas where insurance penetration is low. “THERE IS SIGNIFICANT DOUBT OVER WHETHER A U.S. HURRICANE LANDFALLING ON ITS OWN COULD TURN THE MARKET – PARTICULARLY BECAUSE U.S. HURRICANE IS ONE OF THE BEST-UNDERSTOOD AND WELL-MODELED PERILS, MAKING THIS A SCENARIO THE MARKET CAN MANAGE.” Recent frequency of North Atlantic hurricanes, typically a significant driver of insurance industry catastrophe losses, has been below average, with 2015’s record El Niño one factor behind the low number of tropical cyclones. These conditions have resulted in a protracted soft market, in addition to excess capacity and heightened competition within the reinsurance sector. There is significant doubt over whether a U.S. hurricane on its own could turn the market – particularly because U.S. hurricane is one of the best-understood and well-modeled perils, making this a scenario the market can manage. What we do know is that market-changing events are often surprise losses, revealing unknown accumulations lurking in reinsurance portfolios. Historical examples included Hurricane Katrina’s ability to overcome the defenses in New Orleans and the 9/11 terrorist attacks on the New York World Trade Center. A surprise event is the one you don’t see coming and is the one most likely to change the market. Given the quickly evolving nature of emerging risks such as cyber and pandemic, in addition to more traditional perils, such a loss could arise from numerous sources. Increasing insurance penetration in emerging markets has increased the assets-at-risk of natural catastrophes and the potential for major losses from regions that have been traditionally regarded as “non-peak.” “IT THEREFORE APPEARS INCREASINGLY UNLIKELY THE INDUSTRY WILL AGAIN SEE A MARKET ADJUSTMENT ON THE SCALE THAT WAS LAST WITNESSED IN 2001 AND 2005 DUE TO THE INDUSTRY’S FUNDAMENTALLY ALTERED CAPITAL STRUCTURE.” Given the way in which the industry has changed and the ability of capital to move quickly into the industry post-event, even a major shock or series of shocks may not have the same impact on the reinsurance cycle that it did in the past. Insurance-linked securities (ILS) fund managers continue to line up capital ready to be deployed the minute there is any indication of price hardening. It therefore appears increasingly unlikely the industry will again see a market adjustment on the scale that was last witnessed in 2001 and 2005 due to the industry’s fundamentally altered capital structure. While this is a good thing in terms of the structural integrity of the market, it also means reinsurance companies are faced with the prospect that current soft market conditions will continue to prevail and are, in essence, the new normal. In such an environment, risk selection and risk-adequate pricing are all-important, and there is very little margin for error. Competition in the reinsurance space is now a race to broaden insurance coverage, searching for new business in new territories and risk classes, rather than a race to the bottom with reinsurers competing on price alone. Modeling, data and analytics offer a competitive advantage to those reinsurers that use them to make informed decisions and take informed risks. Underwriters are scrutinizing model output more than ever before, overlaying their own assumptions and risk tolerance and looking for unexpected correlations between books of business to avoid being disproportionately impacted by any one event, and avoiding the private catastrophe. The ability to customize and blend multiple models allows users to tailor the models to their own view of risk, and complement and build on the insights from sophisticated exposure and accumulation management techniques, with increasingly real-time views of portfolio risk. Driving value out of these model output-based decisions will be the main differentiator as reinsurers navigate and make sense of the new reinsurance environment. For instance, one such opportunity is the ability to understand the “spatial correlation” of European flood risk in order to gain a diversification benefit and make quick and strategic M&A decisions by analyzing exposure data in real time. In a market coming to terms with this “new normal” of lower margins, but serving an increasingly important role in creating a safer society through broader coverage, the importance of effective catastrophe risk quantification and management has never been greater.
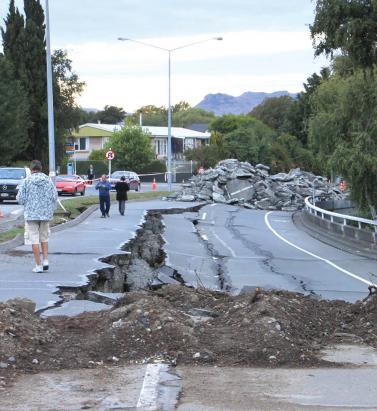
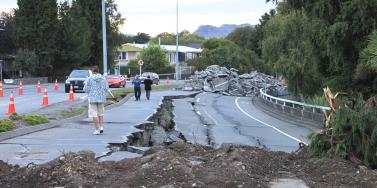
Learning From New Zealand to Avoid Surprises
Secondary hazards, such as liquefaction, and the earthquake sequencing that hit the low-seismicity area of Canterbury, New Zealand, in 2010 and 2011 contributed significantly to the overall loss figures, explains RMS seismology expert Megan Arnold. The phenomenon of “loss creep” has long been an issue associated with major catastrophes, and slight revisions in expected losses are to be expected. However, when unanticipated losses occur and an insurance or reinsurance company radically revises its loss figures upwards there can be a detrimental impact on the business. “When unanticipated losses occur and an insurance or reinsurance company radically revises its loss figures upwards there can be a detrimental impact on the business.” While catastrophe models and exposure management tools have evolved considerably, every major catastrophe is a necessary learning experience. This includes the 2010 and 2011 Canterbury earthquake sequence in New Zealand. Figure 1. Example of liquefaction that caused significant damage to buildings during the Canterbury earthquake sequence. The photo was taken during the RMS reconnaissance trip to Christchurch after the February 22, 2011, earthquake. The magnitude 7.1 earthquake in September 2010 on an unknown fault in Canterbury, which was previously thought to be a low seismic-hazard area, caused surprisingly widespread damage, but no loss of life. This started a sequence of 17 loss-causing earthquakes in the region, lasting over a year. It was the magnitude 6.3 event – right beneath the city of Christchurch on February 22, 2011 – that proved deadly. Many buildings that had been damaged and weakened in earlier quakes were reduced to rubble, and 182 people died. In addition to this low-seismicity area suddenly experiencing earthquake shake damage, the main unanticipated losses were from the unprecedented amount of liquefaction, when saturated or partially saturated soil substantially loses strength causing it to behave like a liquid. This phenomenon produced so much damage that thousands of residential homes in the region were found to be situated on land with liquefaction susceptibility too hazardous for repairs or rebuilding. They were subsequently designated within the government red zone and demolished. The impact of repeated events and the large amount of liquefaction created progressive damage during the 2010-2011 Canterbury earthquake sequence, significantly confusing the loss picture and prolonging the loss adjusting and claims settlement process. The New Zealand Earthquake Commission (EQC) and private insurers are still settling outstanding Canterbury earthquake claims five years later. “These important enhancements to the model’s liquefaction loss component offer a more precise tool with which to gauge the likely impact of this secondary earthquake hazard on a book of business.” The 2010-2011 earthquakes presented an important opportunity to learn more about the behavior of liquefaction. The Natural Hazards Research Platform, EQC and many local agencies in New Zealand funded the collection of liquefaction observation data across Christchurch. This extensive, high-quality data reveals several key observations, including: The spatial extent of the observed liquefaction during the February 2, 2011, M6.3 event corresponds well to the shallow groundwater zones in the area of Christchurch, but not where the groundwater is deeper. The observations confirm that groundwater depth is an important factor in predicting liquefaction initiation. There is significant spatial variation in the liquefaction-related ground displacements over short distances. To account for these large differences in severity over short distances, the modeling methods need to map liquefaction severity parameters for localized variations where possible. Two primary failure mechanisms cause the severe ground displacements, predominantly vertical deformation as well as more laterally induced ground displacement. The Christchurch liquefaction data shows a probable correlation between ground displacement severity and damage. Lateral deformation is found to be more damaging than vertical displacement. Figure 2. Example of lateral spreading that caused severe damage to buildings and infrastructure in Christchurch during the February 22, 2011, earthquake. The photo was taken during the RMS reconnaissance trip to Christchurch. Learning from the earthquakes using observational data and our own research, RMS incorporates four innovations in liquefaction loss modeling into the RMS® New Zealand Earthquake HD Model to help firms better predict the occurrence and severity of liquefaction: Innovation 1: New geospatial methods that map groundwater-well data and near-surface groundwater depth to better determine regions of high liquefaction susceptibility across the country, including low-seismicity areas. Innovation 2: New geospatial methods that use site-specific liquefaction borehole data to create maps that delineate liquefaction initiation potential and severity parameters. Innovation 3: New methods of predicting where liquefaction could result in horizontal displacement. Innovation 4: New analysis of empirical building fragility to liquefaction based on the Christchurch observation data and insurance claims. These important enhancements to the model’s liquefaction loss component offer a more precise tool with which to gauge the likely impact of this secondary earthquake hazard on a book of business by enabling firms to predict a more granular scale loss from liquefaction. The developments have improved how RMS earthquake models determine the spatial pattern of liquefaction initiation, the liquefaction severity at the ground surface (if initiated) and expected building responses to liquefaction-induced ground displacements.
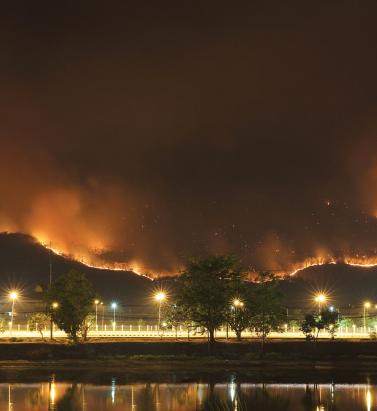
Beware the Private Catastrophe
Having a poor handle on the exposure on their books can result in firms facing disproportionate losses relative to their peers following a catastrophic event, but is easily avoidable, says Shaheen Razzaq, senior director – product management, at RMS. The explosions at Tianjin port, the floods in Thailand and most recently the Fort McMurray wildfires in Canada. What these major events have in common is the disproportionate impact of losses incurred by certain firms’ portfolios. Take the Thai floods in 2011, an event which, at the time, was largely unmodeled. The floods that inundated several major industrial estates around Bangkok caused an accumulation of losses for some reinsurers, resulting in negative rating action, loss in share price and withdrawals from the market. Last year’s Tianjin Port explosions in China also resulted in substantial insurance losses, which had an outsized impact on some firms, with significant concentrations of risk at the port or within impacted supply chains. The insured property loss from Asia’s most expensive human-caused catastrophe and the marine industry’s biggest loss since Superstorm Sandy is thought to be as high as US$3.5 billion, with significant “cost creep” as a result of losses from business interruption and contingent business interruption, clean-up and contamination expenses. “While events such as the Tianjin port explosions, Thai floods and more recent Fort McMurray wildfires may have occurred in so-called industry ‘cold spots,’ the impact of such events can be evaluated using deterministic scenarios to stress test a firm’s book of business.” Some of the highest costs from Tianjin were suffered by European firms, with some firms experiencing losses reaching US$275 million. The event highlighted the significant accumulation risk to non-modeled, man-made events in large transportation hubs such as ports, where much of the insurable content (cargo) is mobile and changeable and requires a deeper understanding of the exposures. Speaking about the firm’s experience in an interview with Bloomberg in early 2016, Zurich Insurance Group chairman and acting CEO Tom de Swann noted how due to the accumulation of risk that had not been sufficiently detected, the firm was looking at ways to strengthen its exposure management to avoid such losses in the future. There is a growing understanding that firms can avoid suffering disproportionate impacts from catastrophic events by taking a more analytical approach to mapping the aggregation risk within their portfolios. According to Validus chairman and CEO Ed Noonan, in statements following Tianjin last year, it is now “unacceptable” for the marine insurance industry not to seek to improve its modeling of risk in complex, ever-changing port environments. Women carrying sandbags to protect ancient ruins in Ayuttaya, Thailand during the seasonal monsoon flooding. While events such as the Tianjin port explosions, Thai floods and more recent Fort McMurray wildfires may have occurred in so-called industry “cold spots,” the impact of such events can be evaluated using deterministic scenarios to stress test a firm’s book of business. This can either provide a view of risk where there is a gap in probabilistic model coverage or supplement the view of risk from probabilistic models. Although much has been written about Nassim Taleb’s highly improbable “black swan” events, in a global and interconnected world firms’ increasingly must contend with the reality of “grey swan” and “white swan” events. According to risk consultant Geary Sikich in his article, “Are We Seeing the Emergence of More White Swan Events?” the definition of a grey swan is “a highly probable event with three principal characteristics: It is predictable; it carries an impact that can easily cascade…and, after the fact, we shift the focus to errors in judgment or some other human form of causation.” A white swan is a “highly certain event” with “an impact that can easily be estimated” where, once again, after the fact there is a shift to focus on “errors in judgment.” “Addressing unpredictability requires that we change how Enterprise Risk Management programs operate,” states Sikich. “Forecasts are often based on a “static” moment; frozen in time, so to speak…. Assumptions, on the other hand, depend on situational analysis and the ongoing tweaking via assessment of new information. An assumption can be changed and adjusted as new information becomes available.” “Best-in-class exposure management analytics is all about challenging assumptions and using disaster scenarios to test how your portfolio would respond if a major event were to occur in a non-modeled peril region.” It is clear Sikich’s observations on unpredictability are becoming the new normal in the industry. Firms are investing to fully entrench strong exposure management practices across their entire enterprise to protect against private catastrophes. They are also reaping other benefits from this type of investment: Sophisticated exposure management tools are not just designed to help firms better manage their risks and exposures, but also to identify new areas of opportunity. By gaining a deeper understanding of their global portfolio across all regions and perils, firms are able to make more informed strategic decisions when looking to grow their business. In specific regions for certain perils, firms’ can use exposure-based analytics to contextualize their modeled loss results. This allows them to “what if” on the range of possible deterministic losses so they can stress test their portfolio against historical benchmarks, look for sensitivities and properly set expectations. Exposure Management Analytics Best-in-class exposure management analytics is all about challenging assumptions and using disaster scenarios to test how your portfolio would respond if a major event were to occur in a non-modeled peril region. Such analytics can identify the pinch points – potential accumulations both within and across classes of business – that may exist while also offering valuable information on where to grow your business. Whether it is through M&A or organic growth, having a better grasp of exposure across your portfolio enables strategic decision-making and can add value to a book of business. The ability to analyze exposure across the entire organization and understand how it is likely to impact accumulations and loss potential is a powerful tool for today’s C-suite. Exposure management tools enable firms to understand the risk in their business today but also how changes can impact their portfolio – whether acquiring a book, moving into new territories or divesting a nonperforming book of business.


Accounting for Extra-Tropical Transitioning Typhoons in Japan
RMS has invested considerable resources in developing an advanced approach to explicitly model transitioning typhoons in Japan, writes Margaret Joseph, Asia typhoon product manager. The pioneering work has helped to develop the most advanced Japan typhoon model on the market; one that makes allowances for the realistic patterns of typhoon wind and typhoon flood loss due to transitioning, which are a major driver of typhoon wind and flood damage in Japan. Not only have more than 50 percent of Japan’s landfalling typhoons either undergone or were undergoing extra-tropical transitioning, all Japan’s largest insured loss-causing typhoons had undergone or were undergoing extra-tropical transitioning when they made landfall. This includes Typhoon Mireille (1991), the costliest typhoon to strike Japan – and Asia as a whole. The importance of understanding and accurately modeling transitioning is, therefore, plainly crucial for catastrophe modelers and for those who use such models for business. Understanding the Phenomenon Japan’s geographical position, both its latitude and position under a strong jetstream, make it very susceptible to extra-tropical transitioning typhoons. A transitioning typhoon tends to be the strongest in terms of wind category at landfall, which has implications for a wind-loss perspective. Extra-tropical transitioning occurs when typhoons in the western North Pacific track toward the pole where they interact with mid-latitude weather systems and the jet stream. If the impact of the interaction is small, then they typically weaken, because of colder sea surface temperatures. If the impact is stronger, then they may change into a different kind of storm, which is initially a hybrid between a tropical cyclone and an extra-tropical cyclone, and which may ultimately end up as a pure extra-tropical cyclone. This transitioning can significantly alter the shape of the wind field, increasing the radius of maximum winds, shifting the location of the strongest winds and, at times, shifting the maximum winds from one side of the typhoon track to the other (Figure 1). Driven by the underlying changes in the wind field, extra-tropical transitioning impacts the storm surge and waves of a typhoon, also affecting the precipitation patterns within a typhoon. Figure 1. Satellite imagery of Typhoon Shanshan (2006). (a) On September 16 this tropical cyclone was located to the north of Taiwan and (b) three days later it tracked north near Japan and the Korean peninsula having undergone extra-tropical transitioning. The difference in the cloud patterns reflects the difference in the wind field prior to and after extra-tropical transitioning. (This is an example of a left-hand side/comma ETT cyclone.) (Source: Image taken from MODIS, NASA.) While several generations of RMS tropical cyclone models have included increasingly realistic representations of extra-tropical transitioning, we have recently concluded our largest body of research to better understand and model transitioning, focusing more specifically on typhoons in the western North Pacific. The peer-reviewed research has informed one of the numerous scientific advancements in the forthcoming RMS® Japan Typhoon HD Model. The rebuilt typhoon model now includes a novel parametric representation of the wind fields that replicates the features specific to extra-tropical transitioning, including accounting for classifications that have a higher probability of occurrence at a given time of year. Also, by being fully coupled, the model represents the impact of extra-tropical transitioning on precipitation, storm surge and wave through changes in the wind field. Figure 2. Examples of extra-tropical transitioning typhoons showing (a) the right-side wind field (e.g., Typhoon Halong, 2002), (b) the comma-shaped wind field with maximum winds to the LHS/RHS of the track (e.g., Typhoon Rammasun, 2008). (Source: RMS research.) While wind is a consideration, (re)-insurers must not ignore the flood component of typhoon risk when pricing the risk and modeling portfolio accumulations. Japan’s geographical position in relation to the “average” typhoon track, has implications for the flood hazard. As a typhoon tracks north, into the subtropics and mid-latitude, it can interact with other weather systems and transition to an extra-tropical cyclone. Storms that are transitioning or have transitioned when they impact Japan can bring more intense precipitation and/or storm surge. While Japan has one of the world’s most advanced flood protection systems, a significant proportion of the country lies below sea level. Consequently, if flood and coastal defenses are breached, widespread and severe flooding could ensue. Overall, typhoon presents both a significant risk as well as a growth opportunity for global (re)insurers. The RMS Japan Typhoon HD Model is designed to help users evaluate all these variables when considering their exposure to typhoon flood. RMS Research in This Area has Been Published in Scientific Journals Using a combination of observed data and numerical modeling studies, RMS modelers investigated the difference in the shape and extent of the wind field in extra-tropical transitioning typhoons as compared to the wind field in the tropical phase. Additionally, the RMS team classified different types of transitioning wind fields, with the important implication that in extra-tropical transitioning typhoons the maximum winds are not restricted to the right of the track. In fact, the maximum winds can be located on both sides of the typhoon track; for one type of RMS-classified transitioning the maximum winds can flip across the typhoon track. The research builds on work from Naoko Kitabatake at the Meteorological Research Institute in Japan, involved work with Professor David Nolan of the University of Miami, and has been reviewed by Professor John Knaff of NOAA/NESDIS/STAR – RAMMB CIRA at Colorado State University and Professor Yukio Tamura of the Wind Engineering Research Center in Tokyo. Loridan, T., Khare, S., Scherer, E., Dixon, M., & Bellone, E. (2015). Parametric modeling of transitioning cyclone wind fields for risk assessment studies in the western North Pacific. Journal of Applied Meteorology Climatology, 54, 624–642. doi:http://dx.doi.org/10.1175/JAMC-D-14-0095.1 Loridan, T., Scherer, E., Dixon, M., Bellone, E., & Khare, S. (2014). Cyclone wind field asymmetries during extratropical transition in the western North Pacific. Journal of Applied Meteorology Climatology 53, 421–428. doi:http://dx.doi.org/10.1175/JAMC-D-13-0257.1 Margaret Joseph is a product manager for RMS Asia Pacific tropical cyclone models, including Australia cyclone, China typhoon, and the forthcoming western North Pacific typhoon model.
