logo image

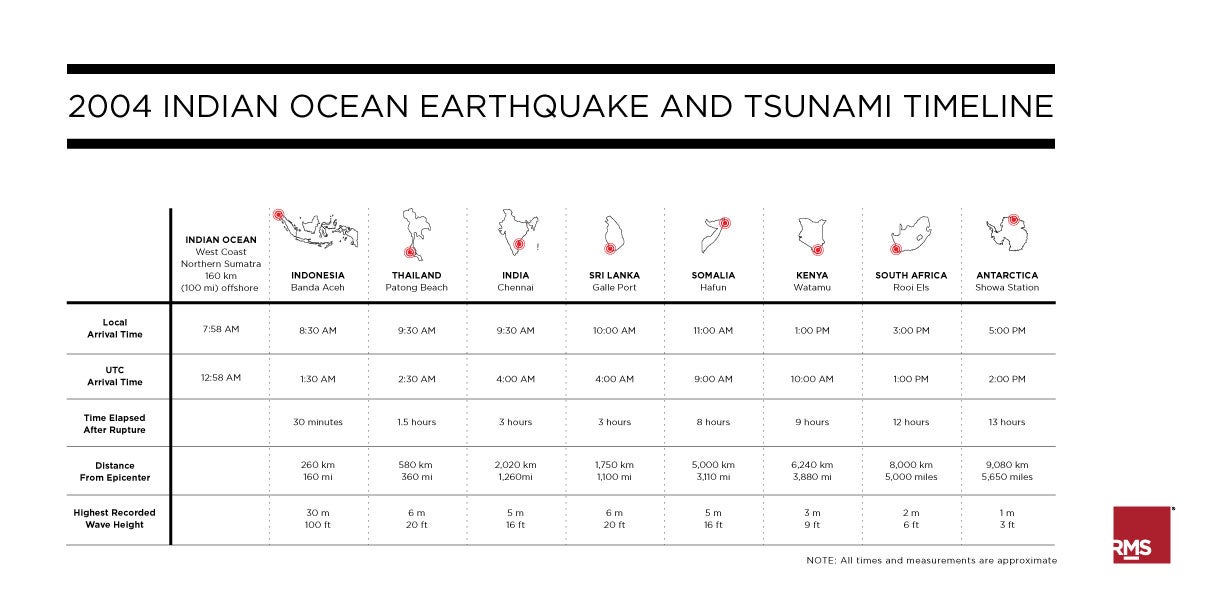
On Sunday, December 26, 2004 at approximately 8 a.m. local time, a massive earthquake occurred along the Indian–Burma plate boundary off the coast of Sumatra, Indonesia. Rupturing over 1,200 km of the Sunda Trench, the magnitude of the earthquake has been estimated between M9.0 and M9.3—with the U.S. Geological Survey’s Centennial Earthquake Catalog estimating M9.1. Occurring at a fairly shallow depth—less than 30 km—the earthquake generated a basin-wide tsunami that inundated coastlines across the Indian Ocean and caused run-up waves farther afield, impacting the eastern coastline of Africa. By the end of the day, it was apparent that the event was going to emerge as one of the worst natural disasters in modern times.

tsunami timeline

Click here for full size image

Economic Toll and Recovery

Overall economic losses from the 2004 disaster were approximately $10 billion, with the majority of loss attributed to the damage in the Indonesia, Thailand, Sri Lanka, and India. The large majority of property damage was caused by the tsunami waves. Along coastlines of most of the affected countries, buildings were situated closer to sea level than is typical of higher latitudes, exacerbating the impacts.

In the aftermath of the event, the international relief efforts across the Indian Ocean were seen as fairly effective. But the longer-term recovery work in certain regions has struggled—due to the overwhelming numbers of people displaced from their homes. There are, of course, examples of well-executed reconstruction efforts. Build Change—a partner organization of RMS—has worked with tsunami survivors in Banda Aceh, Sumatra to rebuild safe, sustainable homes. Ten years after the event, evidence of the destruction wrought by the tsunami remains in the high-impacted areas.

Humanitarian

Humanitarian Impact 

While tsunami in the Indian Ocean have certainly occurred many times before, from the perspective of modern history, the human casualties from the 2004 Indian Ocean Earthquake and Tsunami have no historical equal. More than 225,000 people lost their lives in the disaster, with most of the loss of life occurring in the near field in Sumatra, Indonesia. In Indonesia, the tsunami destroyed virtually every village, town, road, and bridge along a 170-km stretch of coast less than 10 m above sea level. Sri Lanka’s Eastern and Southern provinces were severely impacted, with fatality rate among the population within 1 km of coast between 15% and 20%. In India, entire villages in Tamil Nadu were destroyed.

In Thailand, the tsunami affected local inhabitants and foreign tourists in the densely inhabited Phuket Island. The fatalities among the tourists were a significant proportion of the overall loss of life, as many were on the beach or in hotels near the sea at the time the tsunami waves struck. In addition, the initial tsunami wave in Phuket, which was east of the rupture, began with a receding wave. Many of the tourists (not indigenous to tsunami-prone coastal regions) were unfortunately not familiar with the nature of tsunami waves. In many (but not all) tsunami, the first movement of the sea is a withdrawal. Any occasion when the sea level recedes rapidly and inexplicably should be taken as a signal for immediate flight to higher ground.

Managing Tsunami Risk in the Aftermath

The 2004 Indian Ocean Tsunami highlighted inherent vulnerabilities in the world’s coastlines and the people who live there. Coastal populations are on the increase in many parts of the world, mostly due to the exploitation of sea resources or tourism-related activities. Adequate tsunami mitigation measures— such as tsunami warning systems, education, and land use planning—can be put in place to save lives, property, and the livelihoods of those living on the coast.

Although the impact of the 2004 disaster on the global insurance industry was minimal, it alerted the world to the dangers of tsunami hazards. Worldwide response to the 2004 disaster resulted in the establishment of the Indian Ocean Tsunami Warning and Mitigation System in 2006.

Ten years hence, the world has seen two more earthquake-induced tsunami events—in the 2010 M8.8 Maule, Chile Earthquake and in the 2011 M9.0 Tohoku, Japan Earthquake—causing many clients to inquire where else in the world can events like these happen?

Share:
You May Also Like
Residential neighborhood
October 04, 2023
California Earthquake Authority Invests in Research and Development to Enhance ‘Brace and Bolt’
May 23, 2017
The California Earthquake Authority and RMS Co-host Webinar to Share Insights on California Earthquake Risk Using North America Earthquake Version 17.0

Together with the California Earthquake Authority (CEA), RMS co-hosted a webinar on May 17 for the CEA’s global panel of catastrophe reinsurers to explore how new earthquake science and RMS modeling impacts the CEA and its markets. The CEA is one of the largest earthquake insurance programs in the world with nearly one million policyholders throughout California. In the webinar, we analyzed and shared insights about the risk to the CEA book using the new Version 17 RMS North America Earthquake Models which was just released on April 28. The new RMS model, representing over 100 person-years of R&D, incorporates significant new developments in earthquake science and data over the past decade, including the new U.S. Geological Survey (USGS) seismic hazard model which introduced the Uniform California Earthquake Rupture Forecast Version 3 (UCERF3). The new RMS model also incorporates the Pacific Earthquake Engineering Research Center’s (PEER) new ground motion predictions equations referred to as the Next Generation Attenuation Functions for Western U.S. Version 2 (NGA-West2, 2015). This leverages six times more ground motion recordings (21,332 versus 3,551 to be exact) across almost 4,150 stations, compared to 1,611 stations in the previous version, NGA-West1 (2008). Both UCERF3 and NGA-West2 were funded by the CEA. New insights from billions of dollars in insured losses from global events such as the 2010-11 Canterbury Earthquake Sequence in New Zealand among others have also been incorporated, along with an unprecedented resolution of data on soil-related conditions to better characterize local variability in ground motion and liquefaction. For California, the incorporation of both new earthquake science and improved computational methods enhances our ability to characterize the risk and increases confidence associated with the impacts of large events. A key insight from the new model is that we now understand that more of the risk in California is driven by the “tail.” New science surrounding the potential for earthquake activity in California suggests less frequent moderate-sized earthquakes, but a relative increase in the frequency of larger earthquakes which can rupture across a network of faults creating more correlated damage and loss. While modeled average annual losses (AALs) may be lower for many policies or portfolios, the severity of losses at critical return periods remains consistent, and in some cases even greater.  The intuition here is a shift in the relationships between frequency and severity, increasing the variance. Earthquake is a tail-risk peril and now more than ever, risk management strategies and business practices need a holistic approach to pricing and capital, with a full consideration of the distribution throughout the tail. Another generalized insight from the new model is a more balanced geographic distribution of risk across California. On an industry state-wide level, earthquake risk is now becoming more balanced between Southern and Northern California where it was once skewed more towards Southern California. These new regional patterns of risk, including new correlations within the sub-regions of California and across the state, will suggest new priorities for risk management and new opportunities to diversify risk and deploy capacity in more efficient ways. Of course, specific impacts will vary significantly depending on the particular composition of an individual book of business. A third new insight is that within California, there is now more differentiation in location-to-location risk, allowing us to discern more variability in the risk at the individual locations or at the account-level. For example, the higher resolution models of surficial deposits increase local variability. Thus, relative to average changes in localized territories, there is now more dispersion in those territories. And, much finer-grained treatment of liquefaction allows us to see that many locations previously thought to be susceptible to liquefaction are not, and some are even riskier. Better science and computational methods provide new measures of risk, but it’s more than just the numbers. It’s about the new insights, and the opportunities they create to build a more resilient book of business and create new solutions for the market.…

Renee Lee
Renee Lee
Senior Director, Product Management, Moody's RMS

Renee leads Moody's RMS earthquake models product strategy and roadmap for the global suite of earthquake models and data products. Prior to Moody's RMS, Renee was an earthquake risk consultant, advising Fortune 500 companies on facultative reinsurance transactions, and conducting PML and builders risk assessments for lenders’ technical advisors, corporate risk managers, and brokers.

Renee holds a bachelor's degree in Engineering and Applied Science from Caltech and a master's degree and a Ph.D. in Civil Engineering from Stanford University.

cta image

Need Help Managing Your Portfolio?

close button
Overlay Image
Video Title

Thank You

You’ll be contacted by an Moody's RMS specialist shortly.