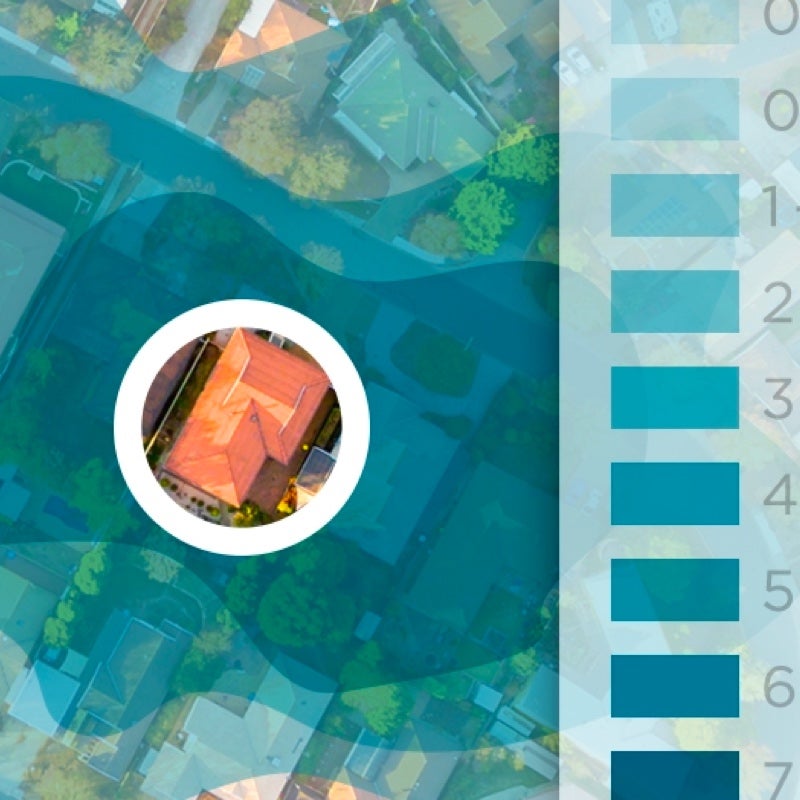
Maps for Geospatial Analytics
Enhance your knowledge of the surrounding risk landscape and develop actionable risk insights for underwriting, accumulation and exposure management, or future business planning with Moody's maps for geospatial analytics.
Understand Your Surrounding Risk Landscape to Drive Better Results
Whether you’re making critical business decisions related to high-value risk locations, trying to discern proximity to various hazards, or looking for areas to target new business, Moody's maps can provide the insights you need. Through visualizing the surrounding risk landscape, you gain the confidence to proceed with the job at hand. Easily determine whether a single location should be underwritten or if too many locations are exposed to significant risk.
Benefits
Enhance Underwriting Decisions
Automation in underwriting is becoming increasingly commonplace, but there are always those risks that need a closer look. Whether a "referral" due to having moderate hazard detected or a large industrial facility that warrants closer inspection, Moody's hazard maps can help clarify the risk landscape and deliver the insights needed to proceed with a decision.
Optimize Your Portfolio
Combining exposure with hazard can enable today’s portfolio manager to quickly and easily identify problematic risk clusters and initiate appropriate remedial action. Moody's hazard maps are underpinned by superior model science and can guide you toward the right decision for your organization.
Expand Your Business
With the power of visualizing a given hazard combined with your existing portfolio, it’s easier than ever to identify and uncover areas to target for business expansion. Utilize best-in-class hazard data that is consistent with our probabilistic offerings.
Inform Disaster Planning
Determining the location for investments or quantifying the cost-benefit analysis of new resiliency measures – including flood defenses – can often be informed through cutting-edge Moody's hazard maps derived from the latest science and technology.
Explore Our Maps
Create clarity on the nearby hazard environment with our suite of Moody's maps.
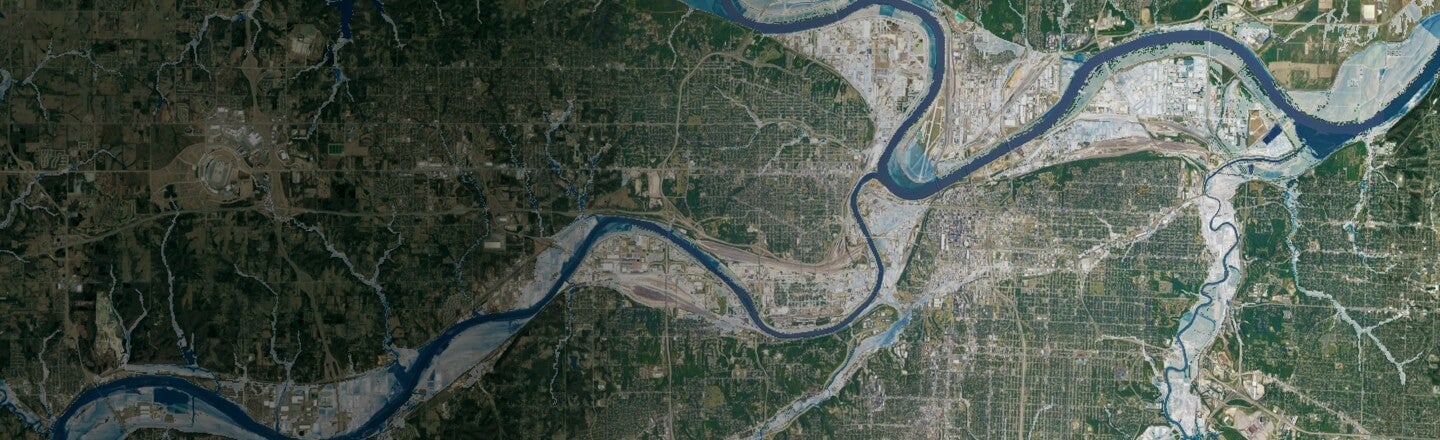
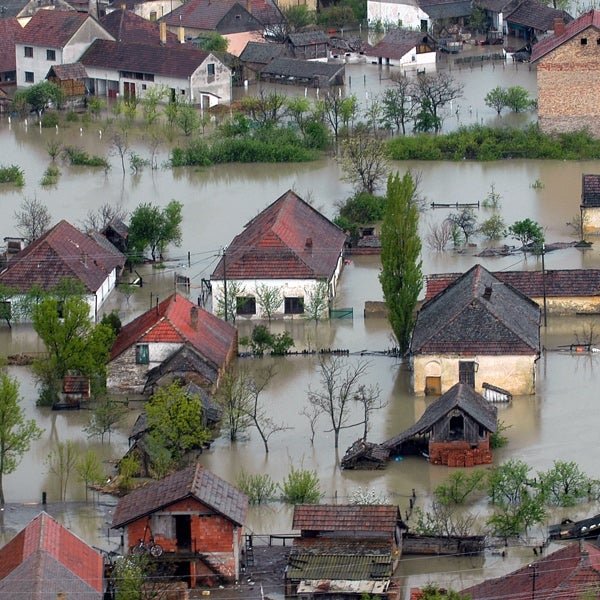
Europe Inland Flood Maps
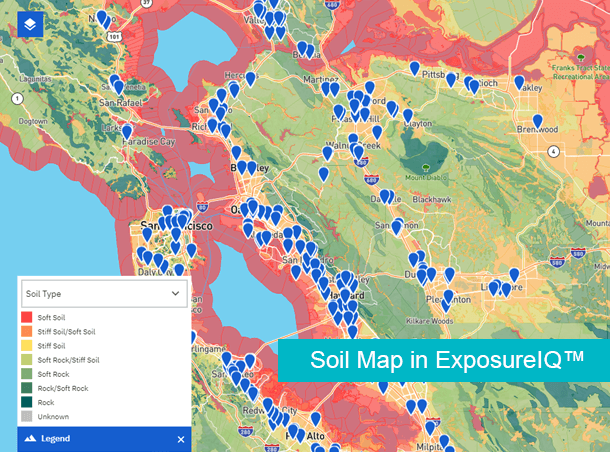
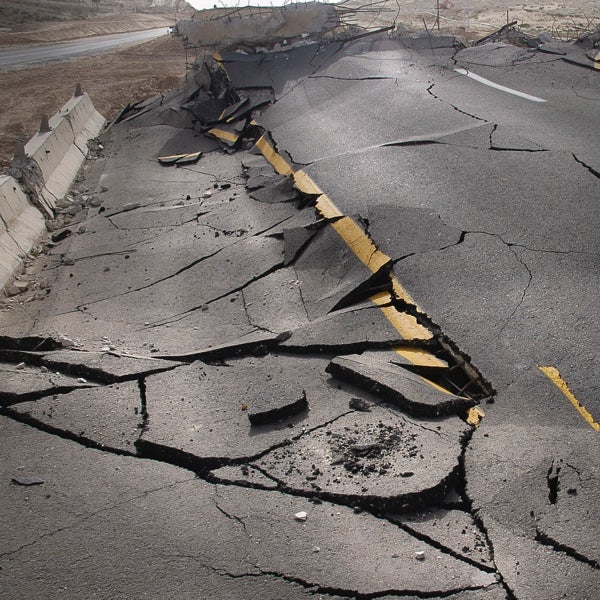
Earthquake Hazard Maps
Global Tsunami Scenario Catalog
Geopolitical Maps
Global Flood Data & Maps
Related Products

Resources


Want to learn more about maps?
