Harvey Shows the Advantage of Cloud Solutions When “Time to Insight” is Crucial
adminSeptember 01, 2017
Farhana Alarakhiya, vice president – Products, RMS
Hurricane Harvey continues to be top of mind at the RMS offices. On Wednesday, RMS hosted a client webinar where Mark Powell, Tom Sabbatelli and Pete Dailey discussed how we have applied our methodology developed for the RMS U.S. High Definition (HD) Flood Model to provide insights to the extent and severity of the flooding from Harvey, with Houston as our top priority. This effort has resulted in a high-fidelity hazard inundation map which is now available to all RMS clients.
For clients who use Exposure Manager, this effort goes one step further. We automatically seed the Harvey hazard layer in the client tenant, to deliver instantaneous access to analytic insights from the U.S. Inland Flood HD Model. This models all sources of flooding across space and time, and can also be used to identify and differentiate locations at risk based on flood extent and severity.
Once logged into the application, our Exposure Manager clients can instantaneously visualize the Harvey flood layer along with their exposures. No need for a large compute to render the data, no fussing with data imports or exports. These insights are literally delivered to a client’s web browser when it matters. They can use the RMS accumulation engine with the built in financial model to define their own damage assumptions for flood bandings and run analytics against their exposures. They can view total insurable value (TIV) and exposed limit at the portfolio level and can drill down into the location level output to identify contracts and exposures that are likely to be affected by this flood event.
This level of insight takes business agility to the next level because you now have more clarity to the question “what does this mean for us” and most importantly, the analytic insights to proactively plan how you can support your clients in their time of need.
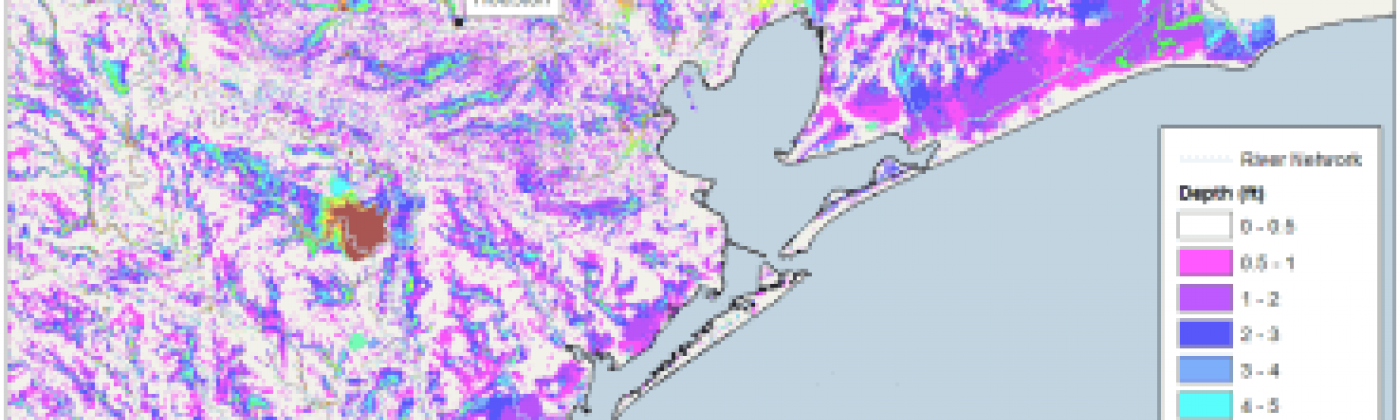
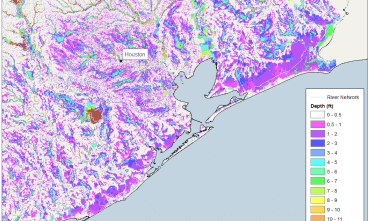
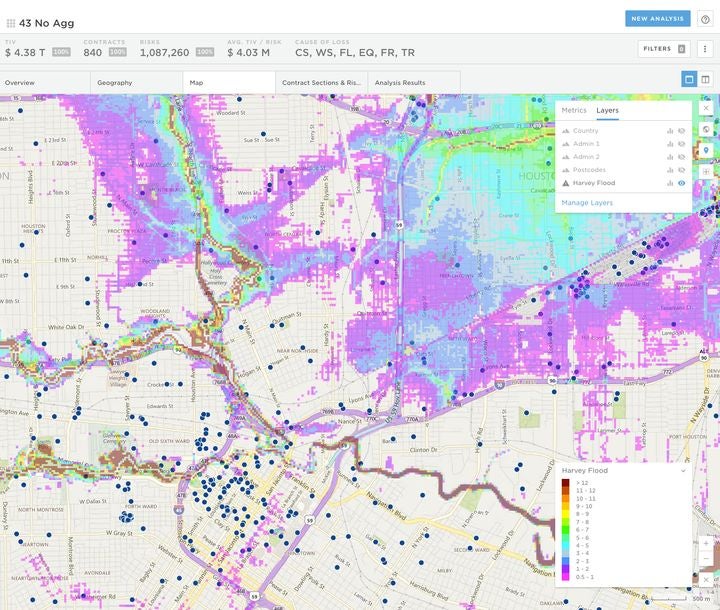
As an illustration, here is a video and a series of screenshots showing Exposure Manager with an accumulation analysis for a hypothetical insurance portfolio in the Houston area. The Harvey inundation footprint generated by the new U.S. Inland Flood model containing water depths in 14 bands is overlaid on the portfolio.
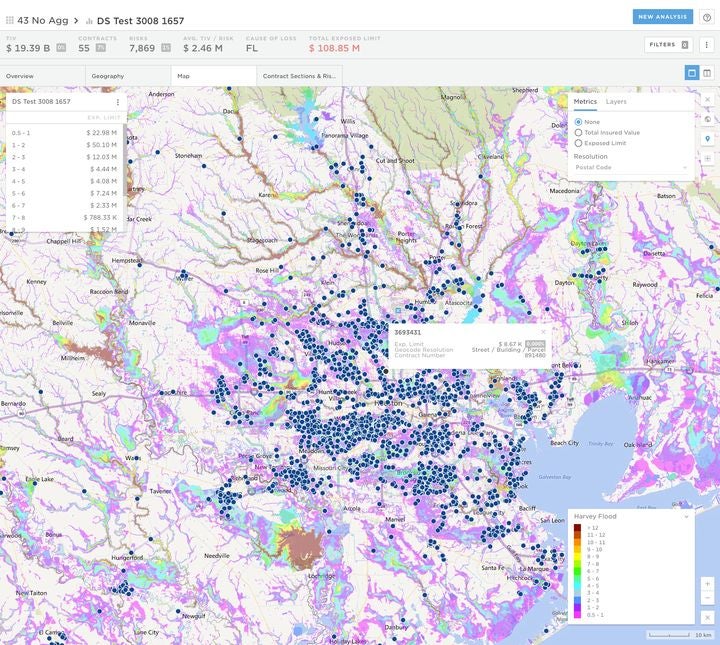
Figure 1. Exposure Manager allows users to view and zoom into the entire Harvey flood hazard layer at high quality resolutionFigure 2. Zooming into the map using Exposure Manager shows exposure point data at high definition, to help pinpoint locations which could be at riskFigure 3. Exposure Manager allows users to visualize post-accumulation views of locations affected to the Harvey flood extent. Loss can be shown by the flood depth bands, and individual risks can be selected and loss detail displayed
For more information on Exposure Manager, click here, or RMS clients can contact their account representative.