U.S. Severe Convective Storm Claims Going Through the Roof
Stephen CusackAugust 03, 2018
During the development of the current RMS U.S. Severe Convective Storm (SCS) model, we found that claims for U.S. Personal lines were growing much faster than general economic inflation. To update SCS claims trends and to try and understand what could be driving this hyper-inflation, we analyzed the new five-year dataset from 2013 onwards, and also a longer duration 17-year period from 2001 to 2017 when observation datasets are of best quality.
Trends in SCS Event Costs
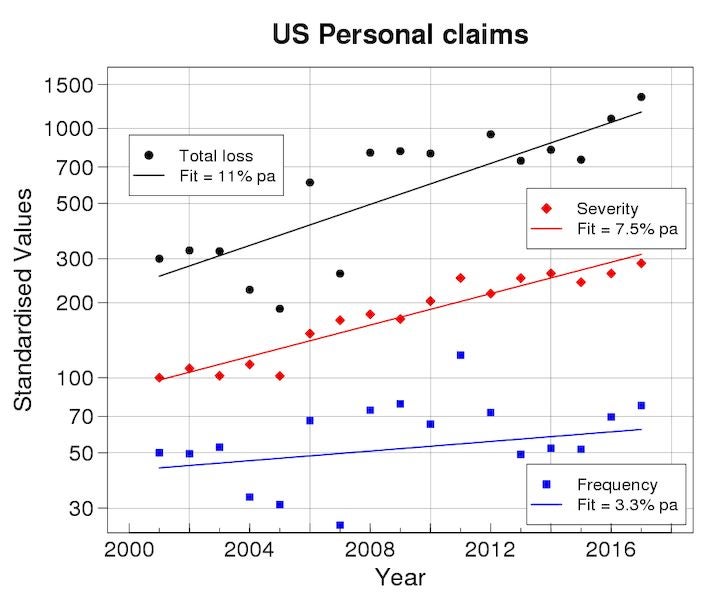
We gathered SCS losses due to hail, tornado and straight-line wind sub-perils from all the information we have on U.S. client claims, which amounts to over one million claims and several billions of U.S. Dollars in total loss. Figure One below shows the time-series of annual SCS loss totals and the decomposition into claim frequency and severity for the period 2001 to 2017. The 7.5 percent per annum trend in claim severity and 3.3 percent per annum rise in frequency combine to produce a growth of total loss, or SCS claims inflation of 11 percent per annum over the 2001-2017 period.
Figure 1: Time-series of annual U.S. Personal claims for SCS events: total loss values are standardized to 300, mean claim severity to 100 and claim frequency to 50 in 2001. The y-axis uses a log scale to suit compound growth.
This SCS claims inflation dwarfs the 3.8 percent per annum growth of non-inflation-adjusted GDP in the U.S., the average CPI growth of 2.1 percent per annum, and the five percent per annum growth of insured values from RMS analysis for Industry Exposure development (excluding growth in number of risks). The relative boost to claims growth over insured values implies loss costs from 17 years ago need inflated by a staggering 150 percent to relate to present-day risk.
Independent studies contain similar trends in SCS claims. For example, the Insurance Research Council (IRC) studied U.S. home claims for all cat events between 1997 and 2013, and found a seven percent growth of mean claim severity and 1.3 percent per annum trend in claim frequency per fixed number of buildings — or approximately 8.3 percent per annum claims inflation. If we re-analyze our available data over the same 1998-2013 period we obtain 9.5 percent per annum growth, consistent with IRC results.
In summary, SCS losses have grown much faster than general economic indicators over the past 17 years. But what is causing this growth? We now look to identify and measure the drivers of these troubling trends.
Hazard Changes
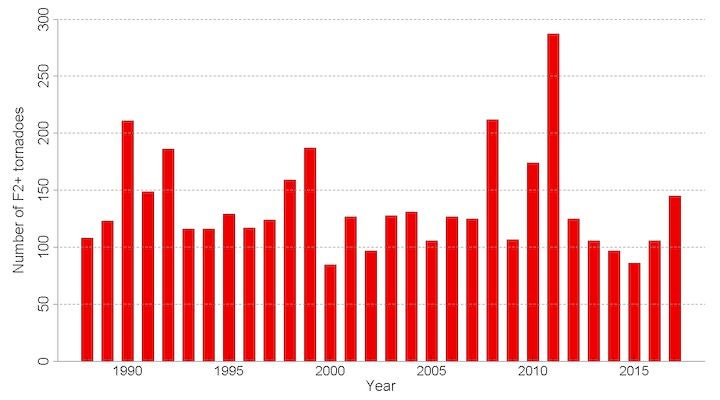
The first suspect is a hazard trend. The number of (E)F2 and stronger tornadoes is a useful measure because it is a good indicator of severe thunderstorm weather, and reports have been homogeneous for at least 20 years. Figure Two shows the annual number of F2 and stronger tornadoes hitting the U.S. using finalized data from the Storm Prediction Center (SPC).
A trend of minus 0.2 percent per annum between 2001 to 2017 does not show an upward trend in significant SCS weather events over the whole period. Next, we defined a Tornado Damage Index as the sum of the damage expected from each tornado based on its area (SPC-observed length and width), and its (E)F-rating, as documented in the RMS North America SCS Hazard validation white paper. At a national level, the index is trending upwards by three percent per annum. Further analysis revealed this was caused by spatially larger tornadoes in more recent times and known trends in observational practices cast doubt on whether this three per cent growth is a real meteorological trend.
Figure 2: Annual number of F2 and stronger tornadoes in U.S. 1998-2017. Source: SPC.
Trends in hail hazard are more important here because hail drives the majority of U.S. SCS insured losses, and our client claims contain a steeper claim severity trend for hail than tornado. Allen and Tippett (2015) remarked how the SPC database of hail reports is dominated by reporting trends throughout their 1955 to 2014 study period and obscuring meteorological trends.
We conducted two analyses to bracket the true hail hazard trend. The upper limit assumes the growing number of hail reports is entirely due to changing hazard. The lower limit assumes any linear trend from 1990 to 2017 is entirely due to reporting trends from Allen and Tippett, then we computed the annualized trend from 2001 to 2017 of this detrended sequence. In both analyses, we count the annual number of SPC reports of hail of two inches (five centimeters) or bigger. These two extreme assumptions produce a range of 0.6 percent and 2.3 percent per annum trend in the period 2001-2017.
We lean towards the lower end of this range because the modern-day trend in hail reports is a continuation of older trends known to be due to changing observational practices. Further, Allen and Tippett find little trend for the largest hail sizes over this period, suggesting little change to severity.
Our best estimate is that trends in hazard climate, weighted towards the dominant hail sub-peril, could add around one percent per annum to SCS claim frequency in the period 2001-2017.
Changes in Exposure and Vulnerability
Perhaps the biggest change in home exposure over the past two decades has been the rise in median age of housing from 30 years in 2001 to 37 years in 2013. Considering ongoing roof replacement, the age of roofs is expected to have increased by around three or four years over the same period. Older roofs are more fragile, hence expected to suffer more SCS damage. The idea that aging homes could drive trends in losses has been discussed elsewhere and we now review studies quantifying the impacts of roof age on SCS damage and claims.
An IBHS study investigated the dependence of damage ratio on the year a house was built, in hurricane winds under 90 miles per hour (145 kilometers per hour), while Alduse et al. 2015 did a modeling study of the effects of aging on failure of asphalt shingles, and both found significantly raised damage due to aging roofs.
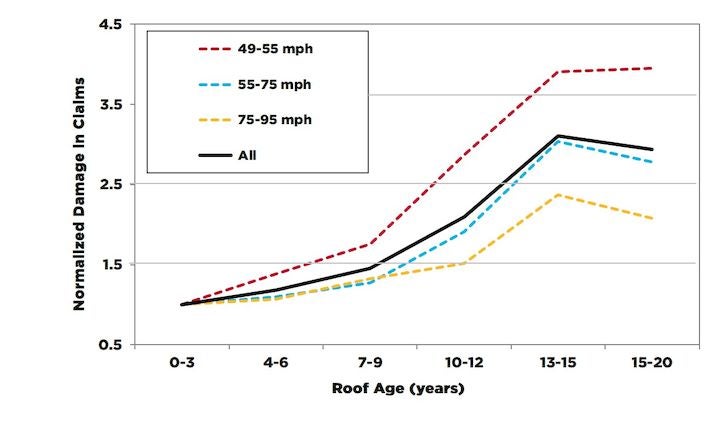
Here, we place more weight on an RMS study on the impact of roof age on the mean severity of claims because it is based on 182,000 claims rather than the much smaller sample of under 1,000 used by IBHS, and based on settled claims rather than fragility modeling. The study highlighted raised claim severity with older roofs, and also found raised claim frequency too. Figure Three shows the combined frequency/severity impact on claims by wind speed, with each bin standardized to 1.0 for roofs aged three years or under.
Roof age has a massive influence on damage: roofs older than 12 years will suffer three times more damage than roofs up to three years old. BuildFax suggests median roof age is around 10 to 15 years, hence an increase by three years since 2001 implies a 50 percent rise in damage from Figure Three, or a mean boost of 2.6 percent per annum to claims inflation.
Figure 3: Homeowners’ claims (normalized to 1.0 for roofs of three years and younger), by roof age and selected wind speed bands.
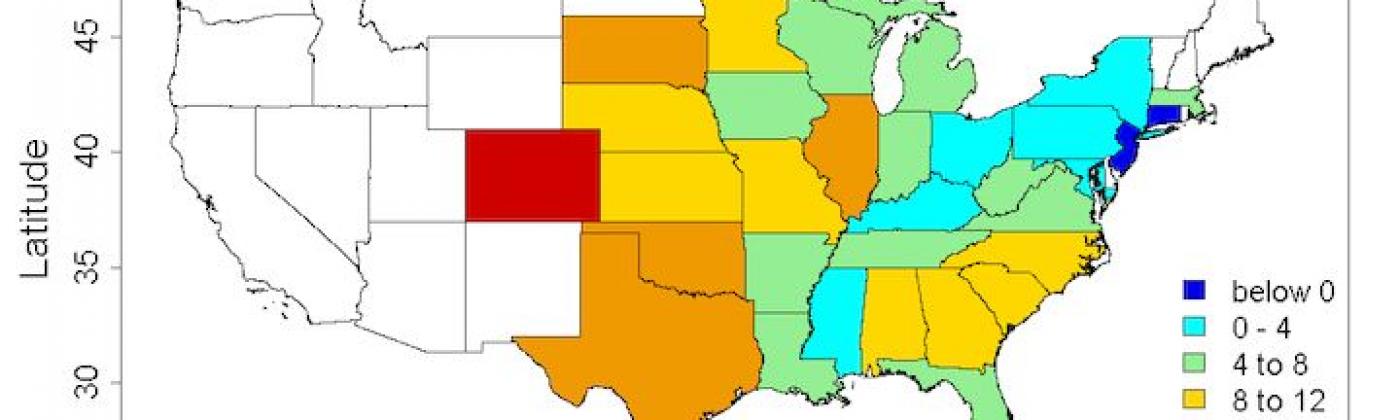
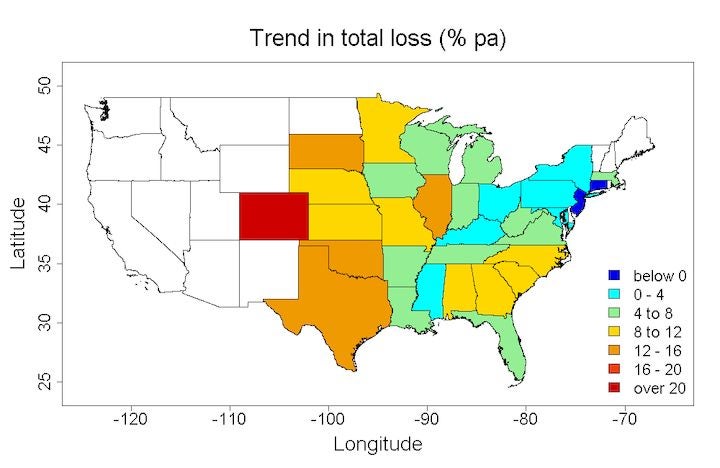
Figure Four contains SCS loss trends per U.S. state, and a clear spatial signal of higher claims inflation in the highest-risk Great Plains area can be seen. The drivers mentioned previously show no signs of a locally enhanced trend in the Great Plains: hazard seems the likeliest explanation but analysis of hail reports and TDI reveals they contain no such spatial signal. Instead, there is evidence of changes in the roofing industry, with unscrupulous behavior among some of the roaming contractors leading to inflated costs, as well as poorer-quality roofs more vulnerable to subsequent damage. This would tend to affect the highest-risk states more than others, consistent with the spatial signal in Figure Four.
To get an idea of the size of the issue, we note there is an eight percent per annum countrywide trend in total losses excluding Great Plains states, which grows to 11 percent per annum when including the Great Plains states. Assuming local increases in the Great Plains are due to changes in how roofs are fixed (we have no other credible explanation) then it could be injecting up to three percent per annum into SCS countrywide claims inflation.
Figure 4: Trend (per annum) in total losses for personal lines, per U.S. state.
Summary
RMS research shows SCS losses increasing sharply at 11 percent per annum from 2001 to 2017, far exceeding CPI inflation and GDP growth. We are confident such hyper-inflation exists in SCS losses, but much less certain about its drivers and their relative roles. We know the costs of roofing labor and materials are running a little over five percent per annum and are much more relevant than CPI or GDP measures. Our best estimates of other factors are:
Changing SCS hazard lifting losses by around one percent per annum
Aging housing stock and roofs boosting a further 2.5 percent per annum
Changes in roof contractor practices injecting up to three percent per annum
Knowing event losses in the past is just one half of the problem for pricing and validation. Knowing how to trend them to present-day conditions is vital too.
Share:
You May Also Like
November 06, 2020
Examining the European Windstorm Outlook This Winter
Update on Multidecadal Variability of European Windstorms
At this moment, you might expect a blog about European windstorms to be about recent Storms Ciara-Sabine, Dennis and Jorge causing wind and flood losses of a couple of billion euros in Europe. However, the losses this winter are modest in a longer-term context. Instead, I think the recent insights into longer-term variations in wind losses could have much more impact on how we price windstorm risk.
We first noticed multidecadal variability of European windstorm activity ten years ago, with 50 percent lower frequencies of damaging storms in the new millennium than in the eighties and nineties. This variability is important: a company’s length of loss experience is unlikely to match the model calibration period, which impacts model validation. It also held the promise of improved risk management, if the storminess changes could be anticipated. We needed to know more about it.
Hundred-year records of wind data at several stations from the Dutch weather service, KNMI, showed pronounced multidecadal variability of storminess throughout the period. An RMS review of published work found:
A wide variety of observational evidence of multidecadal variability of storminess in Europe
An incomplete understanding of multidecadal drivers, including mixed results from earlier climate models
What has the past decade of wind data and research taught us about these slow variations in storm activity? The next few sections will show we have learned a lot over the past ten years.
Observed Storminess: What are the Changes?
The Dutch study was recently updated with nine additional years of wind observations from KNMI, to span 1910-2019. The wind data was homogenized using the same procedures to ensure changes in storminess reflected real meteorological causes rather than observational changes. Figure 1 below shows the main result: the twenty-first century lull has extended throughout the 2010s in the Netherlands.
Figure 1: Time series of annual storm loss in the Netherlands, with 10-year running meansStorminess on the continental-scale was measured using a preliminary dataset of European windstorm footprints spanning 1972 to 2018. Each footprint consists of winds at 25 kilometer cells, and a Europe-wide loss index was computed for each historical event. The aggregate loss was computed for each year, then transformed into a standard normal distribution. The Europe-wide annual losses are shown in Figure 2 below, together with annual rates of occurrence of damaging windstorms, also standardized for comparison.
Figure 2: Time series of standardized annual aggregate loss index and storm occurrence rates, and their five-year running means, for the whole of EuropeStorm Climate Drivers
What could be the drivers of the multidecadal storm variation? Over the past ten years, researchers have made huge advancements in understanding European winter climate variability through analysis of observations and experiments with better climate models. Specifically, they have identified heat anomalies in the North Atlantic Ocean and the Arctic as two main drivers of our winter wind climate at decadal and longer timescales.
North Atlantic Ocean Forcing
Gulev et al. (2013) examined observations over the 1880-2007 period and identified an ocean region in the central northern North Atlantic which forces the atmosphere at decadal and longer timescales, as shown in Figure 3 below. The resonance in this ocean area is caused by the co-located storm track.
Figure 3: The observed correlation, at decadal timescales, of surface heat fluxes and sea surface temperatures in the period 1880-2007; Figure 1b of Gulev et al. (2013). Positive correlations indicate ocean temperature anomalies produce surface flux changes of same sign, to drive the atmosphere.Researchers had been reporting confusing, mixed results from climate models. The situation has since been clarified by Scaife et al. (2012), who explained the need for a high model top and vertical resolution to simulate mid-latitude winter signals. There are few tests with appropriate models. Omrani et al. (2014) found a significant ocean forcing of atmosphere winds, about one half of the corresponding observed anomalies over Europe, from a high-top model. Peings and Magnusdottir (2014) used a more modern climate model and found roughly the same result, and indicated that the same area as Figure 3 was the key to ocean forcing of atmosphere on long timescales. A cooling in this key area raises storminess, and vice versa.
Arctic Forcings
There have been some remarkable changes in northern hemisphere winters over the past 20 years or so: the Arctic winter warmed at a rapid rate, while mid-latitude winters have warmed slower than the global trend, and even cooled in some areas.
Observations reveal a strong link between declining sea ice and a stronger Siberian High. Mechanisms to explain this were reviewed in Cohen et al. (2020), and they viewed the process depicted in Figure 4 as most robust.
Figure 4: A schematic of the process linking Barents-Kara sea ice to European winter climateThere has been a long debate on the size of the Siberian High anomaly forced by Arctic warming, fanned by mixed climate model results. This is getting resolved by recent research indicating climate models have special requirements to simulate mid-latitude winter signals, such as high model top and fine vertical resolution and fully coupled ocean-atmosphere models. Six modern climate models meeting most requirements had a consistent signal of sea ice loss causing a stronger Siberian High, and a weakening of the westerlies carrying storms into Europe. Their modeled signal is about half of the observed circulation change over the past few decades.
The Outlook
How are the two main drivers likely to evolve over the next several years, and what does this entail for European windstorm activity?
North Atlantic Ocean Outlook
Figure 5 shows the mean temperature anomalies (lower plot) for the key ocean area (upper plot). Will the recent cooling continue, or reverse? There are no published forecasts of ocean heat in the specific key region for the next decade. Instead, we estimate changes based on the known drivers of heat in this area, and conclude the likeliest outcome is for persistence of these cooler anomalies in the next few years, implying the stormier North Atlantic of recent years will continue. Will they raise windstorm loss? That depends more on the second driver, and what it does to the Siberian High.
Figure 5: Time series of mean temperature anomaly in the top 400 meters of the ocean in November to April (lower plot), for the region off Newfoundland indicated by red box (upper plot). Ocean temperatures from EN4 were de-trended to remove global warming signal.Arctic Outlook
Anthropogenic forcing is the main cause of Arctic warming and sea ice decline, and the IPCC indicate this is very likely to continue in the future. On shorter timescales, Årthun et al. (2017) describe how North Atlantic Ocean heat anomalies are carried north to modulate sea ice in the Barents and Kara Seas. The northern Atlantic has been cool since 2015, and Figure 6 below shows winter sea ice area in this region has risen since its nadir in 2016. The northern North Atlantic waters are expected to remain cooler over the next few years, and this could stabilize sea ice, or perhaps even reverse its longer-term decline. Raised sea ice in this region would lift windstorm losses.
Figure 6: The sum of sea ice area in Barents and Kara Seas for December and January. Source: NSIDCUncertainties in the Outlook
There are significant uncertainties in the multiannual forecast:
Could the known drivers evolve unpredictably, in this time of changing climate?
Could an unexpected climate process, such as a mode of tropical variability, or ongoing anthropogenic forcing of the stratosphere, or simply random variability, emerge to dominate?
Will an explosive volcanic eruption occur, to raise windstorm risk for the following few years?
Summary
The continental-scale windstorm lull in the first decade of this century continued through the past ten years, with notable regional variability.
There have been several advances in understanding mid-latitude storm climate variability:
Heat anomalies in the North Atlantic Ocean, underneath the storm-track, affect winter storminess in the Atlantic sector
Heat anomalies in the northern North Atlantic modulate Arctic sea ice, notably in the Barents and Kara Seas
Barents and Kara sea ice modulate the Siberian High to affect European storminess
Both observation-based analyses and fit for purpose climate models support these processes
In brief, heat anomalies in the North Atlantic Ocean and Arctic regions explain at least half of the recent multidecadal change in storminess.
The best estimate for the next few years is a slight upward trend in windstorm activity, with significant uncertainty.
The new challenge for insurance is how to benefit from climate forecasting skill, while maintaining safe management of European windstorm risk. We explore this in an upcoming RMS white paper. Debate is positively encouraged, please contact our Product Manager Michele.Lai@rms.com in the first instance.…
Stephen is a Senior Director in the Hazard Climate team. After joining RMS in 2009, most of Stephen’s focus has been on researching and developing the Europe Windstorm (EUWS) model, with particular focus on the hazard. Stephen also spent 18 months leading the recalibration of the U.S. and Canada Severe Convective Storm model, released in January 2014. Before RMS, Stephen worked in a wide variety of research and development posts during 13 years at the U.K. Meteorological Office.