Did Ridgecrest Increase the Chances of a Large Seismic Event?
Marleen Nyst and Delphine FitzenzNovember 15, 2019
Interest in the 160-mile-long Garlock Fault, the second-largest fault in California, has been piqued recently after a Los Angeles Times article about deformation on the Garlock Fault due to the Ridgecrest sequence of events in July 2019. Since the publication of this article, RMS has received information requests focused around two main points.
First, does RMS believe that Ridgecrest impacted the Garlock Fault (and possibly others), and has therefore increased the probability of a rupture there? Second, does RMS support the assumption from the U.S. Geological Survey (USGS) that the most likely scenario is that the Ridgecrest quakes probably won’t trigger a larger earthquake, but have raised the chances of an earthquake of magnitude 7.5 or more on the nearby Garlock, Owens Valley, Blackwater and Panamint Valley faults over the next year. And how would RMS recommend that clients model and capture this increased risk?
Looking at the Ridgecrest sequence, the events occurred on fault structures that were previously unknown (and therefore not in the USGS PSHA maps). The USGS web page that describes the Mw6.4 California event is here; the Mw7.1 California event is here.
The RMS® North America Earthquake Models on RiskLink do have background sources in place that account for the hazard in that area. The maximum magnitude of the largest rupture of just the Garlock Fault (and not a multi-segment rupture connecting the Garlock with other faults, because those can get much bigger) is Mw7.7 (in RiskLink as well as in the UCERF3 model).
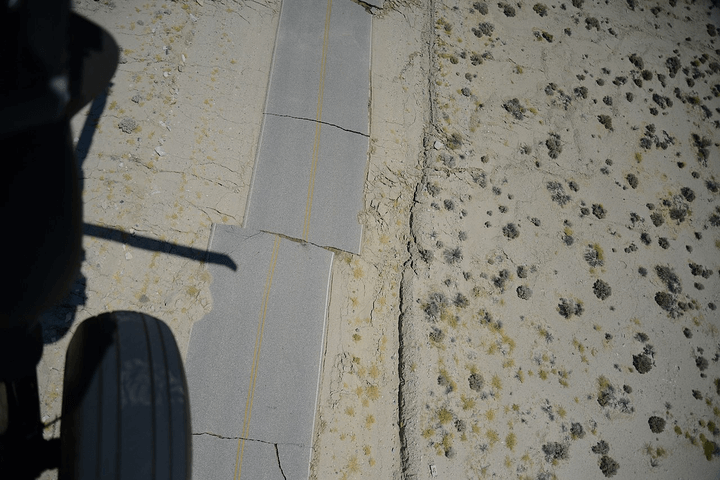
California Geological Survey and USGS geologists and geophysicists with National Guard and Navy personnel view road damage from 3 to 5 feet of right-lateral motion near the expected maximum slip locality along the primary tectonic rupture associated with the M7.1 event. Image taken: July 6, 2019. Image credit: USGS
1. Impact of Ridgecrest sequence on the Garlock Fault
The LA Times article is based on a recent Sciencearticle (Ross et al., Science 366, 346-351, 2019) and focuses on the Ridgecrest events and the wealth of data and observations collected during and just after the events, and presents an early derivation of the timing, location and geometry of both ruptures. The last line of the abstract is the most important conclusion or derivation from this article for RMS (highlighted in red in the abstract below). Recent earthquakes in densely monitored regions, like the Ridgecrest events in California and the Kaikoura event in New Zealand, show how important multi-segment rupture definitions of earthquakes in hazard and risk studies are.
Quoting from the paper’s Abstract:
“A nearly 20-year hiatus in major seismic activity in Southern California ended on 4 July 2019 with a sequence of intersecting earthquakes near the city of Ridgecrest, California. This sequence included a foreshock with a moment magnitude (Mw) of 6.4 followed by a Mw 7.1 mainshock nearly 34 hours later. Geodetic, seismic, and seismicity data provided an integrative view of this sequence, which ruptured an unmapped multiscale network of interlaced orthogonal faults. This complex fault geometry persists over the entire seismogenic depth range. The rupture of the mainshock terminated only a few kilometers from the major regional Garlock Fault, triggering shallow creep and a substantial earthquake swarm.
The repeated occurrence of multi-fault ruptures, as revealed by modern instrumentation and analysis techniques, poses a formidable challenge in quantifying regional seismic hazards.”
The impact of the Mw7.1 Ridgecrest event on the Garlock Fault is described in the Science paper, but it is not the main topic. The newspaper report does somewhat exaggerate the impact on Garlock Fault – a picture of broken up asphalt is not the result of the Garlock deformation. Profiles perpendicular to the Garlock Fault (A-A’, B-B’, C-C’ shown in Figure 6 of the Ross et al. paper) show a maximum offset of approximately 20 millimeters and averages of about five millimeters. The profiles also show that these offsets are confined to shallow depths. We have seen these types of triggered co-seismic slip for other historical earthquakes, such as the 1989 M6.9 Loma Prieta earthquake triggered slip on the Monte Vista fault zone as well as on the Hayward Fault (RMS Loma Prieta report).
Even the authors of the paper have now issued a statement on their website following the overwhelming public concern:
Author’s note:
Since the publication of this article and our associated scientific paper there has been a considerable amount of media attention focused on the results, particularly the detection of so-called ‘creep’ on the Garlock Fault. It’s great to see people interested in our science, but while this creep is interesting, the small motion of the fault does not mean that a major earthquake is going to happen on the Garlock soon. Earthquakes can happen in California at any time, so if you live in earthquake country, make sure to get prepared.
Various early static stress change studies show that, following the Mw7.1 earthquake, seismicity turned on in areas with co-seismic (static) stress increase. Toda and Stein (2019) also observed that the Garlock Fault seems to function as a ‘wall’, with aftershocks north of it and hardly any aftershock activity (and also no background seismicity) south of it. In their article they speculate about the possible causes, with the difference in geology between the area north and south of the fault as the most plausible one.
2. Has the sequence raised the chances of an earthquake of magnitude 7.5 or more on the nearby faults?
When a moderate to large magnitude earthquake happens in the U.S., the USGS automatically releases an aftershock forecast. The aftershock forecast associated with the Mw7.1 California event is here. Straight after a big earthquake, this type of forecast is updated daily, but now it is updated on a monthly basis. It only applies to the area around the main shock, and the forecast is given for four time horizons: one day, one week, one month and one year – either as the probability of at least one aftershock larger than a threshold magnitude, or as the number of events larger than the threshold for each time horizon.
Currently (web site last accessed Oct 31, 2019), the probability of M7+ events are less than one percent for any of the four time horizons. In the “Commentary” tab, more details are given and in the next month there is a 1-in-900 chance for a M7+ around the Ridgecrest area. We have been keeping an eye on this forecast; it has been steadily decreasing over the past months. This method uses statistics on the seismicity catalog of the unfolding earthquake sequence (number of events in the region per magnitude bin through time) and does not use information on the location or level of activity of faults (more details here). This type of forecast is meant to help people prepare for aftershock sequences, and to help people and authorities plan recovery and rebuilding projects.
As you can see when viewing the USGS website, this forecast is also labeled “… the data below are the most preferred data available.” RMS considers this forecast as the official USGS aftershock forecast that is also consistent with our USGS hazard model implementation.
While this type of forecast is useful, it does not give detailed spatial information about where those aftershocks may be more likely to happen. This is a difficult problem to solve and a topic of ongoing research, inside and outside the USGS. One such project is exploring and developing a method called UCERF3-ETAS. This is a hybrid model, that uses UCERF3 as a long-term model and an ETAS methodology for the short-term variations. USGS scientists tested UCERF3-ETAS for the Ridgecrest sequence, and presented their research at the annual Southern California Earthquake Center (SCEC) meeting in Palm Springs in September 2019.
On September 30, the USGS wrote a press release that summarizes the main results of the official USGS aftershock forecast released on the event page (as referenced above). They also provided information on past large earthquakes in the eastern part of the state, included a review of the faults in the general vicinity of the Ridgecrest sequence, and some updated results of this new study shared with the academic community during the SCEC meeting.
Their assessment from the results of this model on the Ridgecrest sequence data, updated in September compared to the forecast published at SCEC (that was for the first month after the mainshock) is:
“Before Ridgecrest, the probabilities of a damaging earthquake on the Garlock, Owens Valley, Blackwater and Panamint Valley faults was low; about three percent in the next 30 years. The USGS estimates that the probability of a M7.5+ earthquake on these four faults is now about six times above the normal background probability through mid-September, but the chances will go down to two to three times the background level during the next year.
The possibility for a triggered event on the more distant San Andreas Fault (80 miles away) has not changed significantly from the background probability, and remains about 20 percent in the next 30 years. The bottom line is that the most likely scenario is a continued decay of the Ridgecrest aftershock sequence. There’s a small chance that there will be another potentially damaging earthquake in the Ridgecrest area. The least likely scenario is a large earthquake on one of the nearby major faults labeled on the map.”
Based on the considerations described above at this point in time, RMS is not changing its view of earthquake risk in California. Official USGS forecasted increases in aftershock probability are too small and short-lived to warrant a model update or recommendation for model changes. Based on our current scientific understanding we also can’t say too much about how the Ridgecrest events have changed overall NAEQ earthquake risk. The main (Mw7.1) Ridgecrest event must have released a serious portion (if not all) of the stress on the fault, but that doesn’t mean the Ridgecrest region can’t experience a large earthquake again sometime in the near future.
Share:
You May Also Like
Marleen Nyst and Delphine Fitzenz
Senior Director & Senior Principal Modeler
Marleen Nyst
Senior Director, Model Development, RMS
Marleen leads the earthquake source modeling team for RMS earthquake models. For the RMS North America Earthquake Models release, Marleen oversaw the hazard component development and its validation.
Prior to RMS, Marleen worked as an Earth Sciences postdoctoral scholar for the USGS and at Stanford University. Marleen holds a master's in Geophysics from the University of Utrecht and a PhD from the Delft University of Technology, The Netherlands.
Delphine Fitzenz
Senior Principal Modeler, Model Development, RMS
Delphine works on earthquake source modeling for risk products, with a particular emphasis on spatio-temporal patterns of large earthquakes.
Since joining RMS in 2012 after 10+ years in academia, she has strived to bring the risk and the earthquake science communities closer together through her articles and by organizing special sessions at conferences. These include the Annual Meeting of the Seismological Society of America (e.g., Earthquake Hazards and Risk: Drivers and Consumers of Earthquake Research in 2015; Risk Management Applications of Earthquake Seismology in 2016).
She gave an invited talk on “How much spatio-temporal clustering should one build into a risk model?” at the Ninth Statistical Seismology workshop in Potsdam, Germany, and was invited to "Workshop 1: Potential Uses of Operational Earthquake Forecasting (OEF) System in California."


