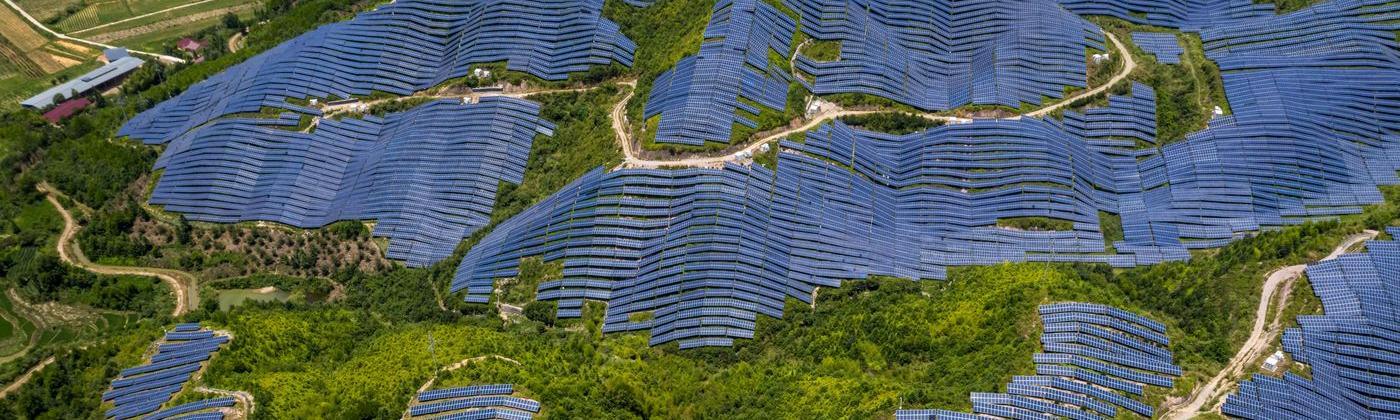
To scale up clean energy generation, there is a growing trend toward renewable electricity sites becoming larger in size and also moving into regions that are more prone to natural catastrophes. This presents (re)insurers with new challenges in understanding current physical and future climate risk. In the U.S., solar farms have seen insurance costs rise, prompted by more frequent extreme weather – in particular hailstorm damage – combined with a surge in demand for cover. Also, the growing size of offshore wind turbines, untested in extreme conditions, and expansion of wind farms into typhoon-prone regions in Asia have created pricing difficulties.
To create risk modeling solutions for these challenges, RMS® has partnered with both (re)insurers and renewables investors. Our global model suite including RMS Climate Change Models, combined with our vulnerability modeling experts, enables RMS to derive a view on losses for renewables infrastructure over its lifetime. How are we using risk modeling to support this rapidly expanding class of infrastructure?
Location, Location, Location
Renewable energy sites, whether solar or wind, are expansive. They typically cover tens of miles with potential for a high hazard gradient across each site, such as an area located near the coast or a river or in an area with high earthquake risk and changing bedrock leading to liquefaction. Understanding how hazard varies across a site and how the total insured value (TIV) is distributed is therefore very important.
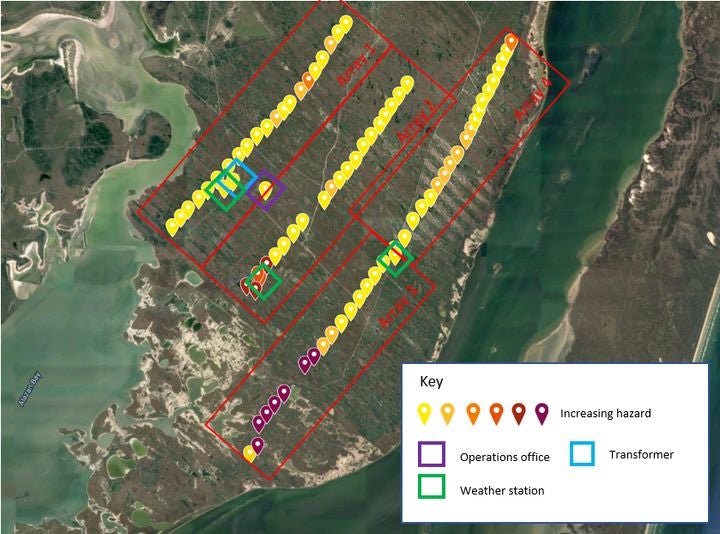
For an initial hazard assessment, the RMS® SiteIQ™ application can be used. Let’s look at an example. A wind farm on the Texas coast covers approximately 17 square miles (45 square kilometers) and consists of 76 wind turbines and five other buildings typically found on a wind farm. Individual risk scores for each turbine and building, obtained from the SiteIQ application and plotted on a map, consider the hazard gradient across the site and the vulnerability of each structure to show those most at risk. These initial insights can help to understand the hazard gradient across the site and decide how best to code the exposure for detailed modeling.
Figure 1: Map showing the location of each wind farm turbine and other associated buildings, including the relative hazard – recorded from RMS SiteIQ and replotted for each location
The way that the exposure data is represented has a huge impact on how the model will interpret it and therefore calculate results. As a most basic approximation, we could consider the entire site to be geocoded to a single point location. The exact position of that point can have huge implications on the loss due to the change in hazard across the area. A better approach is to split the site into blocks of locations of similar hazard and vulnerability, see Figure 1. But best of all, if the hazard varies quite a lot across the site, is to consider each structure as an individual location and define its exact longitude and latitude.
Occupancy Matters
Renewable energy farms consist of multiple components. In our wind farm example, we included an operations and controls building, a substation, transformer, and three weather stations. The RMS® Industrial Facilities Model (IFM) implicitly includes within the vulnerability curves the typical infrastructure found on a particular industrial site.
However, when the location and function of individual buildings are available, coding these separately at their known coordinates – and with a building/contents/business interruption distribution specific to that risk – is useful for more accurate modeling. This is especially true when considering coastal sites where expensive equipment integral to business continuity may be placed further inland and at higher elevations.
Turbines themselves vary significantly between wind farms. Design and engineering are progressing at such a fast pace that turbines are rapidly getting larger with new design features. The vulnerability is also significantly impacted while the turbines are under construction. RMS has defined vulnerability curves for standard turbines within a range of sizes and also has in-house experts to define bespoke vulnerability functions where required.
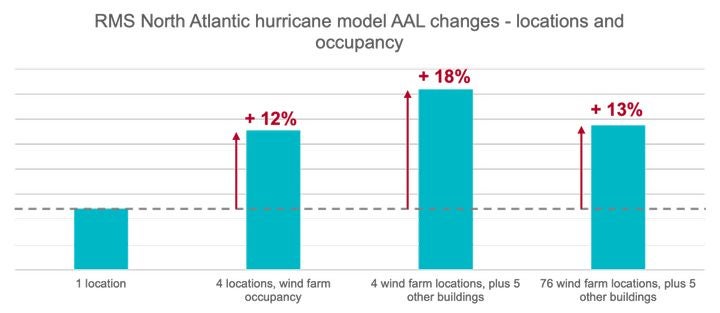
Figure 2: Changes in average annual loss (AAL) for North Atlantic hurricane when coded using varying numbers of locations and occupancies
To demonstrate the impact exposure coding has on losses, we have considered different levels of granularity and associated occupancy, and then run the RMS North Atlantic Hurricane Models. As can be seen in Figure 2, dividing the area into four representative blocks increases average annual loss (AAL) by 12 percent.
For our example, this seems to be a good representation, as defining each individual structure only impacts AAL by a further 1 percent. However, the impact on AAL can range widely depending on hazard across the site, with our individual wind turbine AALs varying by up to 30 percent due to their location on-site. On an individual event basis, the impacts of moving from one location to many can significantly change the loss profile that might trigger or exhaust policies or treaties.
Secondary Modifiers
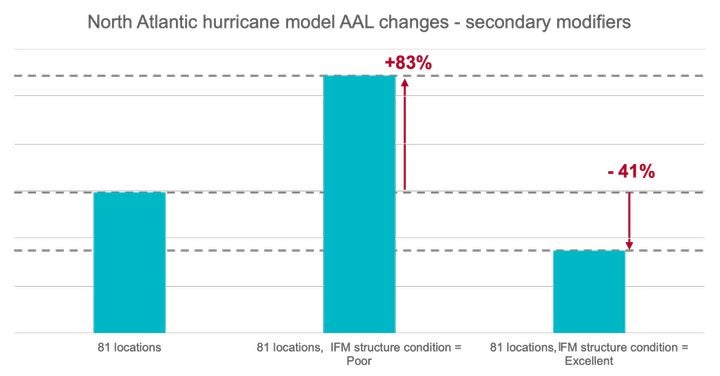
Further refining the vulnerability using secondary modifier information for renewable energy farms can have a large impact on modeled AAL. Secondary modifiers include vertical distribution of contents, business interruption preparedness, redundancy, and the underlying condition of the infrastructure.
In our modeling, using the levers of one particular secondary modifier – the IFM structure condition – resulted in a range in AAL of -41 percent to +83 percent, as shown in Figure 3.
Figure 3: Average annual loss (AAL) changes for North Atlantic hurricane when changing a selected secondary modifier setting
Building Smarter
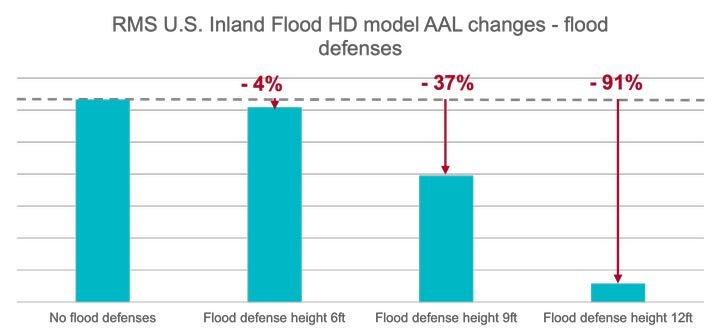
Resilience is important for renewable energy generation, and infrastructure needs to be built with risk mitigation in mind. Flooding is another hazard to consider. Flood models, such as the RMS® U.S. Inland Flood HD Model, can incorporate resilience measures such as capturing the influence of flood defense structures, both permanent and temporary.
The model also enables RMS to calculate where investment in flood defense structures could mitigate damage, minimize downtime, and decrease insurance premiums. Different flood defense heights can be investigated, enabling site owners to consider the cost/benefit of installing different types and heights of structures versus the return period of loss they would protect against.
To demonstrate this type of analysis, we placed our example wind turbine farm’s substation and transformer in a location more at risk from flood. Then we modeled it using the U.S. Inland Flood HD Model, with a range of bespoke flood defense heights. The resulting average annual losses can be seen in Figure 4.
Figure 4: Average annual loss (AAL) changes for U.S. inland flood when modeling varying height flood defenses
Understanding Impacts of Climate Change for a Resilient Future
As the construction of green infrastructure continues to grow, atmospheric natural catastrophes are becoming more frequent and severe due to climate change. It is therefore critical to not only assess current physical risk, but also the risk within the infrastructure’s life span.
RMS has developed Climate Change Models for a number of key perils. They are based on Intergovernmental Panel on Climate Change (IPCC) Representative Concentration Pathway (RCP) scenarios for climate change, modeling the potential change in risk over the next 80 years.
How Can RMS Help?
The RMS Consulting Services team works with clients to better understand how to represent and model risk. While the RMS IFM includes various types and capacities of energy facilities, should your risk go beyond the IFM’s offering, RMS experts can work with you to develop bespoke vulnerability curves. Contact us at sales@rms.com for more information.
Better understand the unique nature of industrial…
Learn More
Kamile Rudaviciute
Consultant
Kamile is a consultant within the Consulting team at RMS, where she has worked with numerous financial services institutions on their risk strategy and implementation of RMS models, data, and technology solutions to improve their performance.
Kamile holds a MSci in geophysics from Imperial College London, where she specialized in understanding subduction dynamics using computational modeling. Kamile is based in the RMS London office.