Decrease your Susceptibility to Poor Insured Decisions: Smarter Underwriting by Using Data to Improve Risk Selection and Refine Pricing
Oliver SmithFebruary 08, 2022
Originally appeared in PropertyCasual360
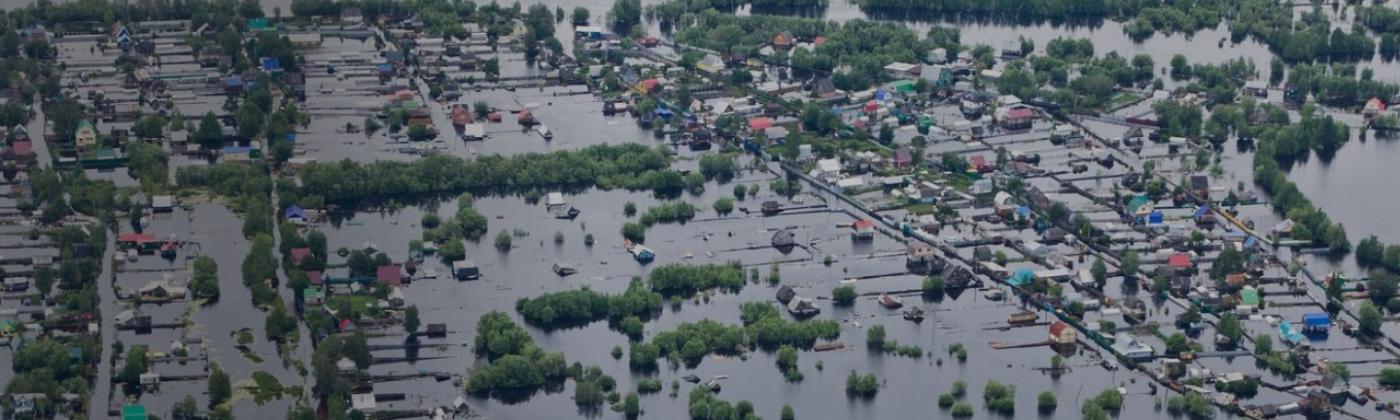
The loss response of a location exposed to a given peril can vary significantly, even when exposed to the same hazard. In this case study, we highlight the importance of utilizing risk characteristics to improve underwriting decisions and refine technical pricing of flood and hurricane business.
Underwriting and pricing guidelines are often built and applied to locations based on their exposure to a given hazard. This determines which risks make their way into the in-force portfolio and at what price, while simultaneously deciding on those that are left for someone else. RMS® conducted an analysis that highlights how risk selection and pricing decisions can be enhanced by moving beyond hazard to leveraging vulnerability attributes, enabling insurers to create competitive advantage and outperform competitors.
Risk Selection: Utilize Building Data to Contextualize Flood Hazard
Utilization of FEMA's Federal Insurance Rate Maps (FIRMs), which offer an “in-or-out” assessment of the 100-year flood zone - or Special Flood Hazard Areas (SFHAs), has been the go-to tool for quantifying flood risk in the United States. Analysis of select zip codes in Houston created two clear observations: risk is not limited to areas defined as SFHAs and, risk within SFHAs is subject to huge variation.
RMS identified that there was non-zero flood risk at the 100-year return period in approximately 40 percent of locations classified by FEMA as outside of SFHAs. This observation aligns with recent events that continually observe claims outside of zones classed as high-risk. Further, RMS observed that within the SFHA, a location may be exposed to no flooding or have greater than 12 feet of flood risk.
Accounting for severity no doubt enables a better understanding of the risk landscape. Of the properties deemed by RMS to have risk at the 100-year return period, 43 percent of locations have less than one foot of risk, which may be within an acceptable underwriting appetite. However, a larger portion is subject to moderate risk which – using traditional methods – makes underwriting decisions difficult by using hazard alone.
Table 1: Analyzed Locations Subject to 100-year Flood Depth
Flood Severity
Description
Count of Locations
Minimal Risk
Less than 1 foot
43%
Moderate Risk
Greater than 1 foot and less than 4 feet
46%
High Risk
Greater than 4 feet
11%
Combining hazard at a location with the susceptibility of given building stock can contextualize risk and provide a more well-rounded view of loss potential, making selection decisions easier. To enable enhanced understanding of risk to specific properties, RMS Risk Scores leverage vulnerability information (like occupancy, construction, height, etc.) that is often already collected by insurers, and then converts return period losses into a simple and easy-to-understand value between one to ten.
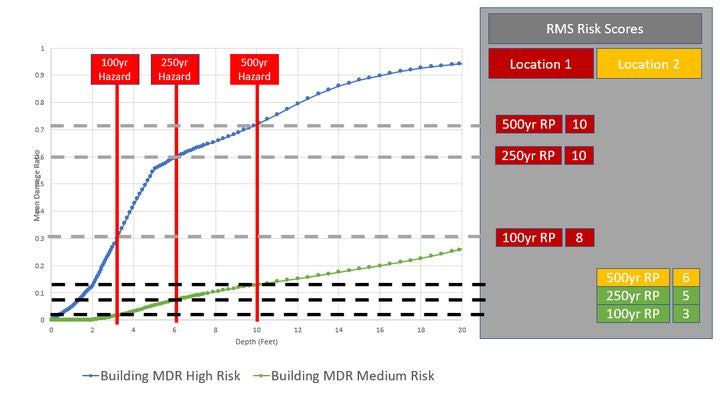
This is highlighted in Figure 1 below, which shows two properties that are both exposed to a moderate hazard at the 100-year return period.
Figure 1: Return Period Risk Scores Refine Insights ( Location 1: residential location, elevated at two-feet, with a basement; Location 2: residential location, elevated 2-feet above ground, without a basement)
In this example, despite being exposed to the same hazard, location 1 has a steep loss gradient. This is based upon the expected response of the building stock to the hazard given the presence of a basement, whereas location 2 shows a much more gradual response. This is reflected in the Risk Score of 8 (“Very High Risk”) for location 1 versus a 3 (“Low Risk”) at the 100-year return period despite the same geographic position.
Access to data that differentiates between the implication of uniform hazard at a location can uncover new insights and enable better risk-based decisions, as highlighted in Figure 1. This often opens the door to risks that have historically been declined, while also highlighting damage potential for locations previously deemed as low risk.
Risk Pricing: Utilizing Building Data for Hurricane Technical Price Refinement
The hazard gradient associated with flood risk is steep and can change over small areas. However, even for other perils that cover wider surface areas, like hurricanes, we see significant loss variation from different building attributes.
Our analysis highlights that within Florida, the average annual loss (AAL) of a wood frame residential building can vary by over 40 times. Expand this across the hurricane exposed states and this multiplier increases into the thousands.
The expected loss from the susceptibility of different building stocks is often less obvious compared with geographic variation. But similar to the example for flood hazard, risk characteristics can also cause huge variation, even when exposed to the same wind speed. This can result in price inadequacy if ignored.
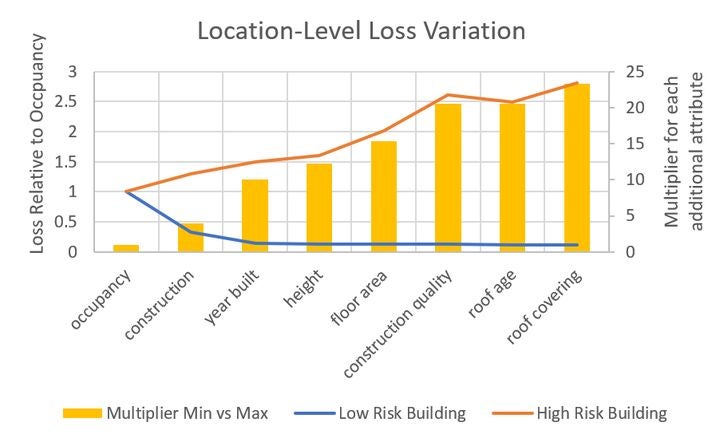
Figure 2: Technical Premium Required to Cover Hurricane Cost
Figure 2 shows an analysis of an individual residential property in exactly the same location and consequently, exposed to the same hazard. This highlights how the premium required to cover technical risk varies with additional attribution. The location with low vulnerability characteristics requires only about 10 percent of the premium relative to knowing just occupancy, while the location with high-risk characteristics requires close to 300 percent of the premium.
When comparing the two locations, the technical cost varies by over 15x when adding details of other primary characteristics and expands to greater than 23x once details around secondary characteristics are also added. This is the difference between requiring US$100 or US$2,330 to cover the technical price for a location with the same insured exposure.
Making Your Data Count
Insurers go to great lengths to capture as much information about a risk as possible. As we have shown, these details matter. This study highlights that it would be a missed opportunity to not leverage information – often already collected today – when making risk selection and pricing decisions.
The analysis suggests that the consequence of using hazard alone is that insurers are turning away risks with very low susceptibility and loss potential, or unknowingly taking risks into the portfolio with high-loss potential given a very low hazard.
It also shows that without a means to account for and benefit from risk attribution in rating mechanisms, insurers miss out on offering competitive rates for resilient building stocks, while collecting inadequate premium for others.
Based in London, Oliver is an Associate Director within the data product management team, responsible for overseeing the development and release of Moody's RMS data offerings across multiple peril regions and delivery vehicles. Oliver joined Moody's in 2013 and has held roles in the Global Knowledge Center and Model Product Strategy teams prior to joining Product Management in 2016. Oliver is a Certified Catastrophe Risk Analyst and holds a bachelor's degree in Economics and Finance from Keele University.