Quantifying Liability Accumulations for Clash Scenarios
Katerina ChristopoulouMay 16, 2022
The occurrence of large and complex events has historically shaped the insurance market. They typically erode capital and introduce large degrees of uncertainty – creating unprecedented conditions that then initiate dramatic changes to the industry with severe impacts on multiple lines.
As a result, there is an increasing awareness and a desire to understand systemic risks. The fallacy of examining events as “standalone” is being proven wrong with frightening frequency; interconnectedness is a key factor in all risks.
This awareness – together with societal changes, emerging threats, new business practices, as well as new and evolving insurance products – adds complexity to an already challenging risk landscape.
In an effort to make better, rational, data-driven risk decisions, insurers have recognized the need to increase their efforts to measure the risk not only to their property portfolios but across all lines of business. This need has been compounded by insurance regulators and rating agencies requiring the industry to understand and quantify the underlying risks.
The COVID-19 pandemic is a recent example in which governments, regulators, planners, and the insurance industry worked together to manage the impact on the overall financial system. After all, the insurance industry’s responsibility is to provide stability and to pay the claims that fuel economic recovery after disasters.
Pushing the Boundaries
RMS is at the forefront in the understanding of systemic risk with recent investments in state-of-the-art modeling methodologies and toolsets. Recently, RMS collaborated with the Centre for Risk Studies at the University of Cambridge to push existing boundaries in modeling event losses to cover lines of businesses outside of the traditional property domain of most catastrophe models.
This project laid the foundation for the quantification of liability modeling and property-liability clash in life and non-life insurance. The outcomes of the project were the precursors of new and innovative R&D for liability initiatives.
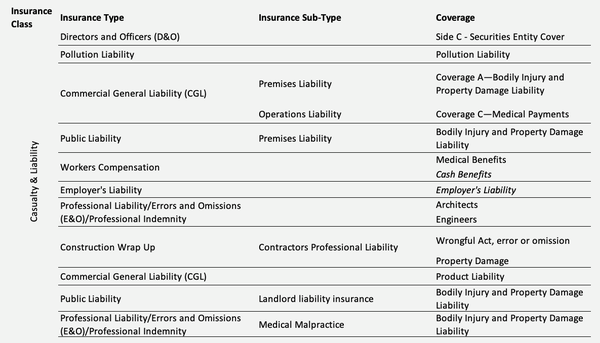
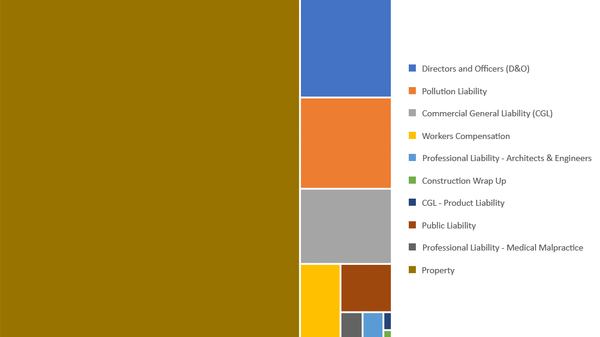
At the core of these initiatives, is a complete Liability Risk Management Framework, which quantifies liability accumulations against a myriad of possible scenarios. Figure 1 provides an example of a clash scenario between property and casualty lines from an earthquake.
Figure 1: List of liability types for an earthquake-triggered liability event.
This end-to-end framework supports the essential risk management disciplines of exposure data capture, loss modeling, and reporting yet is simple enough to be transparent and flexible to allow for easy customization. To calculate losses in a consistent and objective manner, we developed explicit mechanisms to understand and measure litigation risk.
Event-Specific Loss Calculations
How liability losses develop is highly specific, based on the coverage afforded (terms and conditions), the scenario that has occurred, and the insured’s business operations – as well as what they may have (negligently) done or not done. Every scenario is unique. When a scenario occurs, it sets conditions, which may cause coverage(s) to trigger in specific ways.
Understanding the potential impact of a scenario requires specific and rigorously parameterized calculations to quantify loss – rather than broad-brush, top-down calculations. The key components behind the Liability Risk Management Framework that allow for such a bottom-up approach to liability loss quantification are coverage trigger pathways and a probabilistic litigation model.
Coverage Trigger Pathways
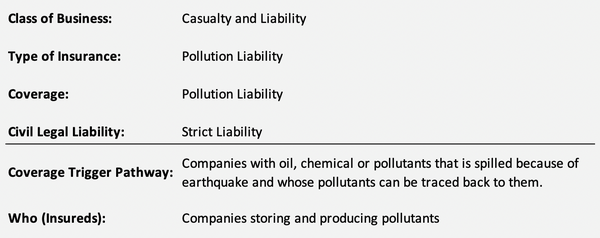
Coverage trigger pathways (CTPs) are scenario- and coverage-specific mechanisms that describe how different liability insurance coverage payouts are triggered by a given event, or liability trigger (Figure 2). Liability triggers can be considered for any natural catastrophe or man-made event that can result in consequential liability.
The severity of an event is responsible for the activation, or not, of a policy through the triggering of liability coverages. We developed and continuously update an extensive database of CTPs that cover a wide range of perils.
Figure 2: Example coverage trigger pathway for an earthquake-triggered liability event
Probabilistic Litigation Model
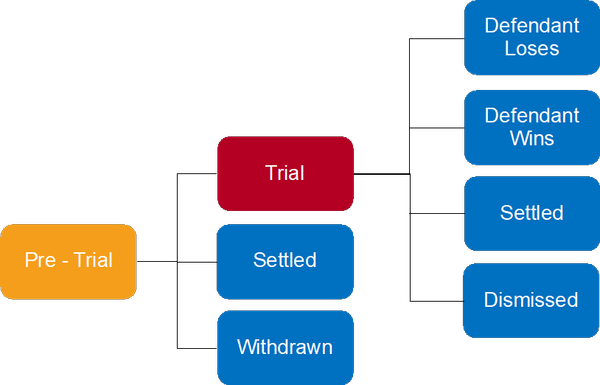
The probabilistic litigation model simulates the litigation journey from legal filing to resolution (Figure 3). The model takes as an input a mean number of cases and the loss is sampled at an account-coverage level from a loss distribution that considers several lawsuit outcomes pre- and post-trial.
In addition, historical data has been analyzed in order to define the outcome and cost distributions for each liability type. The probability of an insured business participating in the loss process depends on its location, size (as measured by revenue), and industry sector.
Figure 3: Probabilistic Litigation Model lawsuit outcomes
Stress Scenario Modeling: Prudential Regulatory Authority Case Study
To comply with regulatory requirements and ensure resilience, insurers must regularly stress test their portfolios to assess risk materiality. The U.K. Prudential Regulatory Authority (PRA) will conduct a general insurance stress test beginning this month that includes natural catastrophe and cyber scenarios. As part of the RMS initiative, we have applied our tools and framework to perform an analysis of the PRA’s California earthquake stress scenario.
The scenario involves the sequence of two severe, correlated earthquakes affecting the San Francisco Bay Area. The first event ruptures the Hayward Fault. This is followed by an event in the nearby Rodgers Creek Fault.
The modeled aggregate economic liability losses for just one of these earthquakes are expected to be 25 to 45 percent of the combined property and liability losses. Figure 4 shows the distribution of modeled industry losses among the examined insurance lines for the Hayward Fault event.
Figure 4: Modeled loss distribution for a Hayward Fault event scenario
Growing Importance of Liability Clash Scenarios
RMS has continued to expand the model library of liability clash scenarios to cover a broad spectrum of threats ranging from natural catastrophes (including climate conditioned) to man-made and climate change litigation events. We recognize that this area of modeling is new but growing in importance to the market and individual insurers.
If you are interested in this work and wish to discuss it further or explore partnership opportunities, please contact us.
New Ways of Modeling Property-Liability Clash and Uncovering Hidden Risk
Natural disasters and other large catastrophes can trigger huge economic losses potentially among multiple insurance lines. RMS, in collaboration with research partner Cambridge Centre for Risk Studies at University of Cambridge, have developed eight template scenarios that model liability clash triggered by natural or man-made catastrophic events.
This research was primarily focused on property–liability clash modeling and was the continuation of the two-year Global Exposure Accumulation and Clash (GEAC) project. GEAC laid the foundations for a risk data schema for the various insurance lines, as well as an approach to modeling insurance clash among life and non-life insurance. Please see here for more information.
The project resulted in liability loss assessments for various scenarios including natural catastrophes, cyber and terrorism (see Figure 1 below). Although these scenarios are extreme, they are well within the realm of possibility and are aimed at stressing the various types of liability insurance.
Each of these scenarios has been implemented as a model template that follows a common structure, including a primary stochastic event along the lines of the 200-year return period (RP) loss based on RMS’ modeling of economic property loss and a narrative explaining the event. The templates also include indicative coverage trigger pathways (CTP) and ground-up loss estimate calculations by liability coverage type. CTPs are sub-narratives for each of the loss triggering liability insurance types and provide details for the coverage specific loss modeling and mechanisms by which claims could arise.
A central feature in the loss methodology framework (Figure 2 above) is the legal settlement model that allows the litigation loss estimation. The model produces different outcomes based on which legal costs and four types of payouts are estimated as appropriate. The payouts considered are settlement amounts, special damages, general damages and punitive damages. The costs of legal proceedings were not included in the modeling.
To understand this better, the following example considers the effects of a catastrophic wildfire scenario:
U.S Wildfire
In recent years, California has experienced larger, more frequent and destructive wildfires that pose a significant risk to insurers and have implications on property and liability lines. In 2018 alone, there were 8,054 wildfires in California with the most destructive one in the state’s history being the Camp Fire (Cal Fire) that broke out on November 8, 2018, in Butte County, about an hour’s drive north of Sacramento.
The fire spread over 153,000 acres (~62,000 hectares) and 18,800 structures were destroyed including 14,000 residences and about 530 commercial structures[i]. According to the Insurance Information Institute, an initial estimate of the Camp Fire event placed the range on insured losses between US$8.5 billion and US$10.5 billion dollars at the time of the event.
Narrative
The modeled scenario assumes a wildfire event in Southern California that spreads southeast. The event was selected from the RMS® United States Wildfire HD Model stochastic event set and satisfies the requirement of the 200-year RP countrywide property economic loss. The wildfire starts in the Los Padres National Forest north of Santa Barbara, and quickly spreads southeast, amassing over 880,000 acres or 356,000 hectares (Figure 3) of scorched earth. The fire is ignited from a faulty power line, which sparks into the surrounding overgrowth and quickly spreads. The fire is amplified by the drought occurring in the region, which has caused very dry and flammable conditions. The drought is attributable to climate change.
Coverage Trigger Pathways
Coverage trigger pathways are scenario-specific and describe how different liability type payouts are triggered by a given event. The wildfire scenario impacts various classes of liability insurance and eleven coverage trigger pathways have been identified and modeled. The list is not exhaustive but aims to give an indication of the potential for costly insurance claims.
An example of the scenario pathway that leads to Commercial General Liability (CGL) claims is shown below (Figure 4).
Liability Loss Estimates
Under this scenario, RMS modeling of property ground-up economic loss for the insurance industry is estimated to be US$21 billion. Using the above liability model, RMS estimates the total estimate for the liability economic loss according to this scenario is around US$10 billion.
The most affected liability line is Commercial General Liability (CGL). The figure below shows the distribution of losses by liability line. The largest driver of losses is attributable to the policy held by the utilities provider, accounting for over 87 percent of the CGL loss.
The use of scenarios to estimate and manage exposure accumulations is considered a common practice among the insurance industry. Accumulations can have a spatial element but can also occur in a non-spatial manner. In the case of liability for example, risks are connected through more complex networks that may include trade connections or business activities. Where location is no longer the driving mechanism for a critical accumulation formation the role of non-spatial accumulation scenarios in multi-line risk management can be pivotal.
The Liability Footprint
Other events modeled as part of these property-liability clash scenarios, produce a wide range of loss profiles driven by different liability coverages. These have thus far served to inform our modelers of the potential situations and degree to which liability insurance classes contribute to catastrophic losses. This represents one area that has not been well-understood by the insurance market.
Thus far, the industry has not adopted established cat risk modeling practices, for the liability risk management. RMS is interested to learn more about the various ways insurers approach this challenge. Please feel free to reach out to share any feedback or questions by contacting derek.blum@rms.com or shruti.deshmukh@rms.com.
Read More
Katerina Christopoulou
Senior Principal Modeler, RMS
Katerina is a senior principal modeler and joined RMS in 2011. Apart from her involvement in the GEAC project during her time at RMS, she developed various property exposure models for climate hazard perils, mainly in Europe. Katerina also worked at Pembroke Managing Agency, where she was responsible for the validation of external catastrophe models and the quantification of non-modeled risks.
Before moving to the U.K., she held positions as Land Surveyor and GIS engineer in the Hellenic Military Geographical Service and Geopaeikonisis Ltd. Katerina has over 20 years of experience as a Geomatics Engineer and during her career to date, she has worked on large-scale private and publicly, EU funded projects.
Katerina is a Chartered Geomatics Surveyor and a corporate member of the Royal Institute of Chartered Surveyors (MRICS). She holds a PhD in Geographic Information Science from UCL and a master's degree in GIS from University of Leeds.