Lessons from Hurricane Ida: How Catastrophe Modeling Can Help Plug the U.S. Flood Protection Gap
Firas SalehMay 25, 2022
Flood remains the most underinsured climate risk in the U.S. Consulting firm Milliman estimates that just 4 percent of U.S. homeowners have flood insurance coverage, which is primarily provided by the National Flood Insurance Program (NFIP). With 4.88 million policies, the NFIP provides around US$1.3 trillion in flood coverage.
This low flood insurance protection rate is not a surprise, despite the emergence of analytical tools to quantify flood risk and a growing number of companies offering private flood coverage.
The only mandated requirement for homeowners to obtain a flood insurance policy is when they are buying property within a Federal Emergency Management Agency (FEMA) Special Flood Hazard Area (SFHAs) using a government-backed loan or a conventional loan backed by lenders Fannie Mae or Freddie Mac.
These SFHA boundary “flood zones” do not reflect the current flood risk but are backward-looking and not frequently revised; learn more in this RMS® blog. Even when flood is insured, sublimits are generally applied to policies to lower the insured portion of flood losses.
Other factors impacting flood insurance take-up rates include, but are not limited to, a misconception by many homeowners that flood is covered under standard homeowners’ policies and a lack of understanding of the associated incurred cost from flooding. For example, during the Hurricane Harvey floods in 2017, the NFIP paid out an average claim of around US$95,000 per policy.
Hurricane Ida: Uninsured Flood Losses
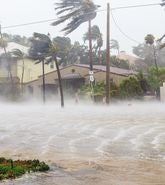
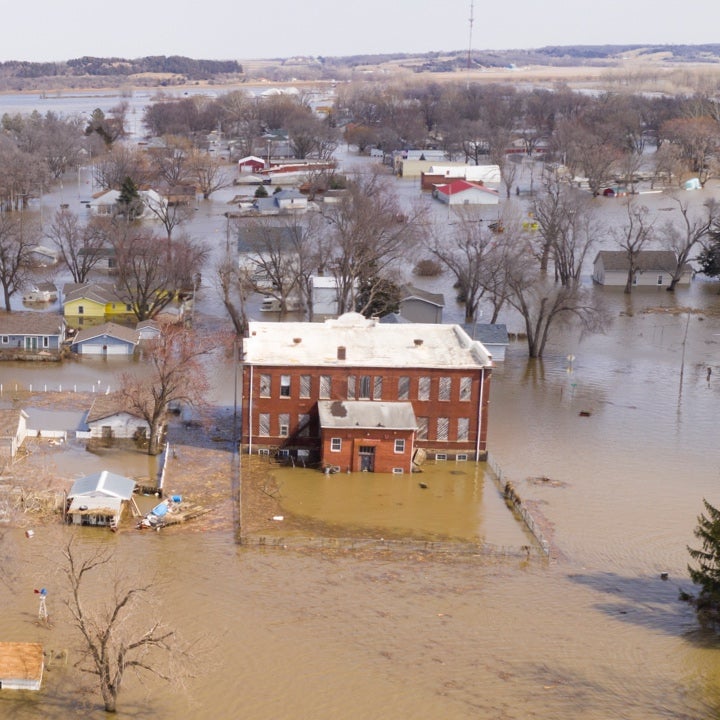
It was Hurricane Ida, a Category 4 hurricane in 2021, that highlighted some of the biggest policy challenges that the U.S. government and the insurance market face in their attempt to increase take-up rates. The storm demonstrated that inland flooding could have a catastrophic effect on communities not traditionally impacted by major hurricane and flood events.
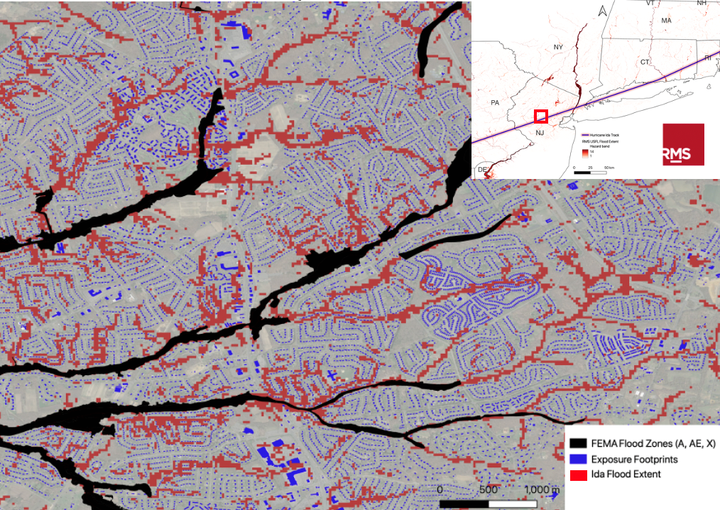
Hurricane Ida was particularly devastating in areas located outside the FEMA flood zones as shown in the flood footprint example (Figure 1), where flooding is clearly impacting areas perceived as low hazard risk. Hurricane Ida was not the only event to expose these limitations. For example, during Hurricane Harvey in 2017, only less than 25 percent of the exposure impacted by flooding in Texas had flood insurance.
Figure 1 Example in Central New Jersey showing the relevant FEMA flood zones, exposure footprints, and Hurricane Ida flood extent simulated by the RMS U.S. Inland Flood HD Model
For all Ida’s impact on regions, RMS estimates a protection gap of up to 80 percent for residential lines. To help understand how Ida’s losses were distributed, we leveraged the latest RMS® U.S. Inland Flood HD Modelalong with the proprietary RMS high-resolution industry exposure databases (IEDs) representing insured flood exposure.
We also used the RMS economic exposure database (EED), which has information on all potentially insurable properties within residential, commercial, and industrial sectors but excludes infrastructure (e.g., roads and bridges) and government-owned buildings.
The flood protection gap for extreme flood events is generally complex to model because of the hyper-local nature of flooding, a lack of public datasets on insured flood exposure, and local variability in exposure primary characteristics, such as the presence of basements or the height of a building’s first floor. In addition, the gap varies substantially by region, especially in inland areas along Ida’s path that have very little insurance take-up rates given that the areas may not have been previously exposed to flood risk.
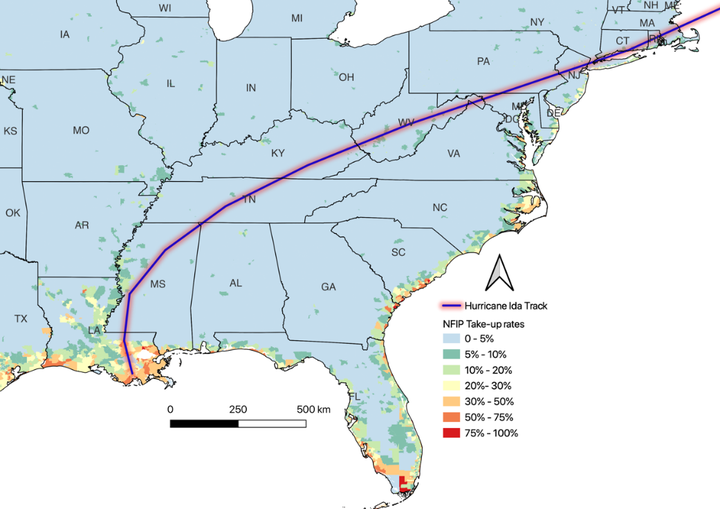
To better understand the variability, we will examine the NFIP take-up rates (Figure 2) along the path of Hurricane Ida using the RMS view of NFIP exposure, which is based on the 2019 policy-in-force data and statistics published by FEMA. This proprietary dataset includes NFIP exposure at risk differentiated by the line of business at a granular resolution.
Flood Insurance Gap Regionality
Louisiana has one of the highest numbers of in-force NFIP policies, yet Ida impacted less than 30 percent of residential lines in coastal counties and 20 percent or less for inland counties within the state. Mississippi saw a similar coverage gap as most flood insurance policies were in force near the Mississippi River, which did not experience significant flooding during the storm.
Turning to the mid-Atlantic and Northeast regions, which were impacted by Ida’s remnants, the NFIP take-up rates for residential lines were substantially lower within most inland areas as compared to coastal areas. In fact, NFIP take up for residential lines is less than 5 percent outside coastal areas, including some of the hardest hit by Ida’s flooding.
Figure 2 demonstrates how take-up rates vary by region and shows the potential risk carried in areas that could be vulnerable to pluvial flooding and overtopping of minor rivers. It is important to highlight that even in areas with high flood insurance take-up rates, flood-specific sublimits are expected to lower the insured portion of flood losses.
Figure 2: Path of Hurricane Ida and NFIP insurance take-up rates
In the context of the flood protection gap, the data demonstrates that many communities and homeowners could be exposed to risk from different sources of inland flooding but generally lack adequate flood insurance coverage. Even with the increased take-up rates of private insurance, the NFIP still makes up the largest share of coverage, which overall remains low when compared to the exposure at risk.
Commercial Lines: Take-Up Rates
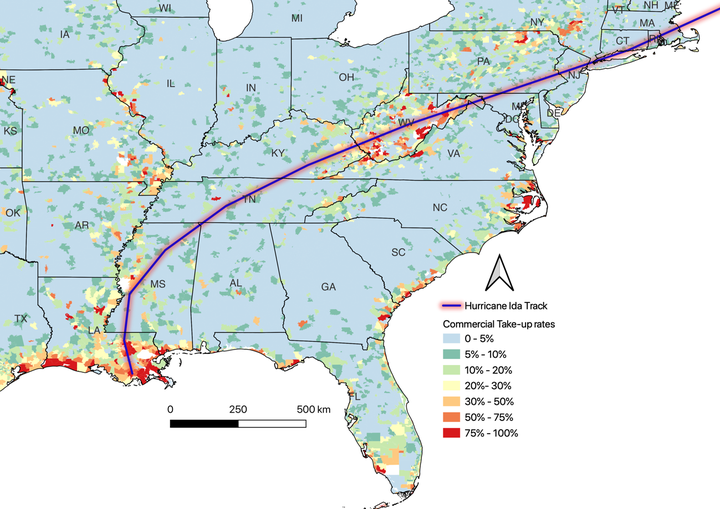
In contrast, commercial lines take-up rates for flood insurance are significantly higher than for residential lines (Figure 3). The estimated take-up rates for commercial properties in the regions impacted by Ida are up to 70 percent.
This is generally covered by private flood insurance because commercial companies primarily procure comprehensive policies in the private market. The NFIP provides commercial flood insurance for small and medium-sized firms but with significant limitations.The statutory flood limit for a commercial building is US$500,000 plus US$500,000 for contents,which may not be enough to cover the entire losses sustained during a flood event.
The flood insurance protection gap is not just an issue in low and medium FEMA flood zones. Even within FEMA’s SFHAs there is significant underinsurance. While larger corporations are likely to supplement their NFIP coverage by taking out private flood insurance policies, many small and medium firms are underinsured for flood risk.
Figure 3: Path of Hurricane Ida and private commercial insurance take-up rates
Outlook on Flood Coverage Opportunities
While the flood protection gap presents numerous challenges to society, the advances in modeling and analytics present the chance to build more resilient communities. They also offer a business opportunity for insurance companies that have the appetite to start or grow their flood book of business.
The RMS U.S. Inland Flood HD Model, powered by the RMS Intelligent Risk Platform™and derivative flood data products provide insights on potential loss at both the location and portfolio level, to empower insurance firms to better screen and price risk. Analytics from such platforms also present opportunities for insurance agents to positively influence clients’ perceptions by helping them better understand their potential financial risks associated with flooding.
Another key driver of opportunity lies in the evolving landscape of the NFIP itself. In October 2021, FEMA introduced Risk Rating 2.0, representing the biggest change to its methodology used to calculate flood insurance premiums since the NFIP’s inception in 1968.
Risk-based pricing of flood policies is a step in the right direction, but the FEMA SFHA boundaries will continue to dictate the mandatory insurance purchase requirement if a mortgage is obtained from a federally regulated lender, which remains a constraint.
The updated Risk Rating 2.0 rates for existing NFIP policyholders took effect on October 1, 2021, for new policies and on April 1, 2022, for existing or renewing policies. It is expected that 73 percent of NFIP’s existing policies will see an increase in premiums, the majority between US$10 and US$20 per month. However, consumers that see a larger surge in their premiums could start looking for alternative solutions from the private sector.
This could be a big opportunity for insurers to grow their private flood business when empowered by state-of-the-art modeling and data analytics that provide relevant insight. The latest updates to the RMS U.S. Inland Flood HD Model also enable a fully correlated view of risk with the RMS North Atlantic Hurricane Models. Clients can carry out analysis for premium adequacy on hurricane policies by incorporating tropical cyclone-induced flooding risk.
Additionally, clients can leverage the RMS modeling framework to adequately reflect the impacts of community or property-specific flood mitigation measures by reducing premiums, offering increased limits, and developing novel insurance products for low-to-medium flood risk zones. Finally, clients can use the model to devise new rating territories and test underwriting guidelines for reduced or increased limits and the impact on premium, capital adequacy, and portfolio performance compared to static SFHA map-based approaches.
Understanding the nuances of flood risk, looking outside of the SFHAs, and engaging with customers to show how flooding can affect their communities – all supported by effective risk analytics – can help insurers to offer innovative solutions to fill the substantial gaps in coverage.
Dr. Firas Saleh joined Moody's as Director of Model Product Management in 2020. He oversees Moody's RMS U.S. Inland Flood and Wildfire HD Models, working closely with clients and across Moody's functional teams on defining and executing the vision, strategy, and roadmap for Moody's RMS flood and wildfire products.
Firas holds a Ph.D. in Geosciences and Natural Resources from the University of Pierre et Marie Curie - Paris VI (Sorbonne Universités), France. He has a strong professional track record in the U.S. Federal Government, industry, and academia.
During his academic tenure at different institutes around the world, including the Paris School of Mines (Mines Paris-Tech), New Jersey Institute of Technology, and Stevens Institute of Technology, his research was focused on implementing quantitative forward-looking analytics to assess climate and weather-related physical risk and impacts on critical infrastructure resilience.
At Stevens, he was part of the team that pioneered and productized the coastal-inland operational flood forecast systems for Port Authority of NY-NJ critical facilities (JFK, LaGuardia, Newark, and Teterboro Airports) and NJ Transit. He has co-authored more than 30 publications in peer-reviewed articles, conference proceedings, and book chapters.
He also served as a Senior Commercial Specialist at the U.S. Embassy in Baghdad and Amman, the U.S. Commercial Service, and the U.S. Department of State. He received the U.S. Department of Commerce Gold Medal Award for his distinguished federal service in fostering collaboration between government and industry concerning water and construction. The Gold Medal is the highest honorary award from the U.S. Secretary of Commerce.