What were the main factors driving these losses, how often can we expect such conditions, and what might we expect in forthcoming years?
Weather Anomalies and Droughts in Southern Brazil
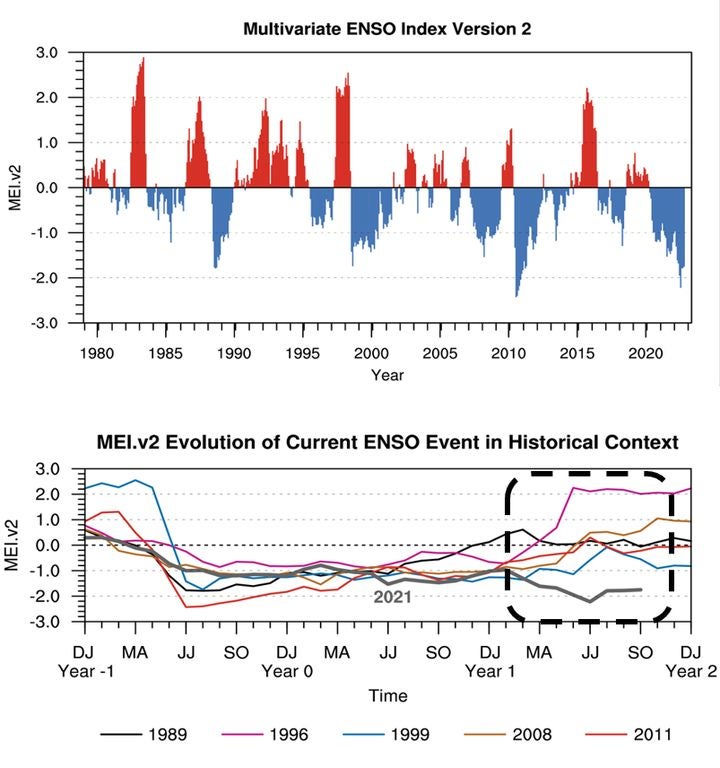
Crop production in Brazil is particularly sensitive to meteorological changes driven by the El Niño-Southern Oscillation (ENSO) in the eastern tropical Pacific Ocean. And as seen during 2021–22, southern Brazil is more likely to experience drought conditions during an ENSO cooling phase, also called a La Niña phase (Figure 1).
Figure 1: Multivariate El Niño-Southern Oscillation index (MEI) from 1979 to the present (top) and the evolution of 2021–22 ENSO events (bottom) compared to other La Niña events since 1989 (Source: National Oceanic and Atmospheric Administration, Physical Science Laboratory)
In the 2021–22 southern Brazil growing season, the abnormally hot and dry conditions that impacted soybean and first-season corn (grown from November to March) were influenced by the current La Niña, which began at the end of 2020.
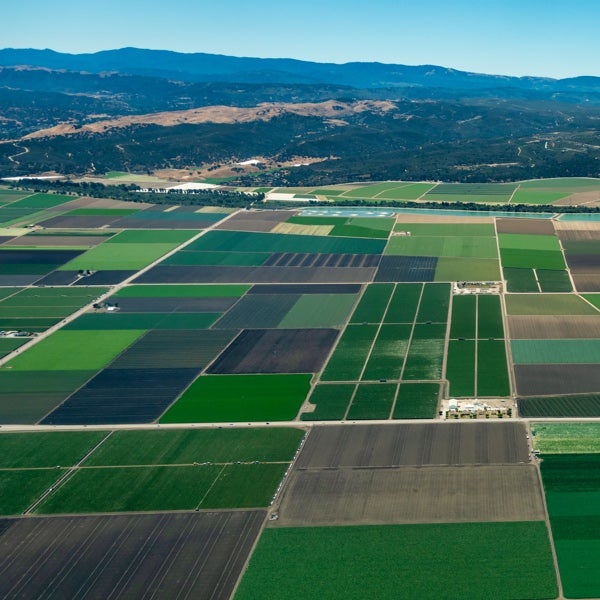
Soybean farmers in southern Brazil account for roughly half of the nation’s production. Most Brazilian agriculture is rain-fed. (Only around 13 percent of cropland was equipped for irrigation in 2020.)
So, farms were hit with especially high rates of crop failures and 11.4 percent less production overall than in the previous cropping season. In Rio Grande do Sul, the southernmost state, 56 percent of the soybean harvest was lost, with more than 195,000 farms reporting production losses.
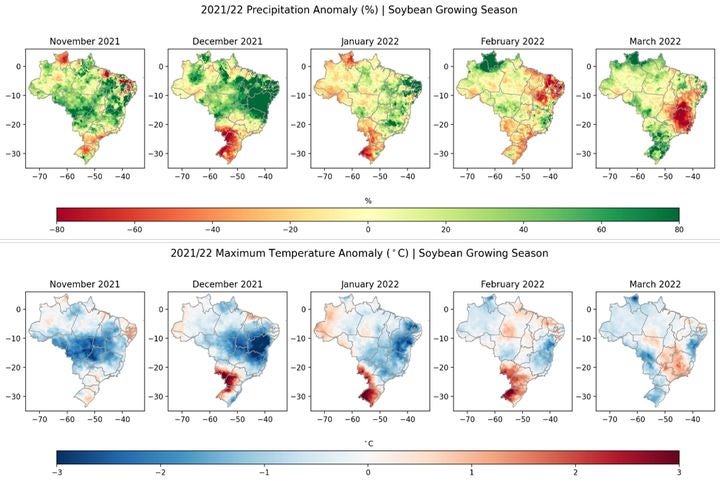
Figure 2: Gridded anomalies in seasonal precipitation (top row, by percentage) and mean daily maximum temperature (bottom row, by degrees Celsius) in 2021–22 relative to mean conditions from 1980–2018 for soybean growing season in southern Brazil
RMS® studied the weather patterns of the 2021–22 cropping season in Brazil using daily 25-kilometer gridded radiation, precipitation, temperature, and evapotranspiration data for the current year relative to historical climatology from 1980–2018.1 All historical weather data was quality checked and bias corrected in-house at RMS.
The abnormally high temperatures and low precipitation in the current year contributed to increases in evapotranspiration and daily heat stress experienced by the crops (Figure 2). Precipitation was more than 50 percent below normal in the midseason months of December 2021 and January 2022.
Daily maximum temperatures were more than two degrees Celsius above normal from December to February in many parts of Rio Grande do Sul, Santa Catarina, Paraná, and southern Mato Grosso do Sul (see Figure 2).
In addition, long-term trends toward warming and more intense but less frequent precipitation (with a higher proportion of runoff) also exacerbated low soil moisture conditions. In fact, the 2021–22 growing season for soybean in southern Brazil showed the highest number of dry days with zero precipitation from planting to harvest since 1980.
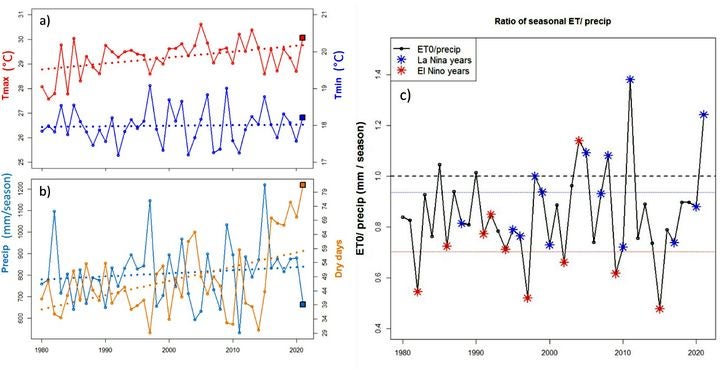
In contrast, the total amount of seasonal precipitation in 2021–22 was below normal but still within the range of historical variability (Figure 3). Comparing seasonal water demand (i.e., reference evapotranspiration) to total precipitation in the 2021–22 season, the overall atmospheric water demand exceeded supply by around 25 percent, which was the second-highest ratio in the historical reference period and far above the average in just La Niña years.
Figure 3: Time series and trends in historical weather data: (a) daily maximum and minimum temperatures, (b) seasonal precipitation and number of dry days, and (c) ratio of seasonal reference evapotranspiration (i.e., water demand) to precipitation (i.e., water supply). All time series are averaged across soybean growing areas in southern Brazil and for the growing season months of November to March. For (a) and (b): The latest 2021–22 growing season is marked with squares, and trends are shown with dashed lines. For (c): El Niño and La Niña years (i.e., mean in-season MEI values > 0.5 and < –0.5 respectively) are marked with red and blue stars, with the mean of those years shown with dotted lines. A ratio of 1.0 is marked with a dashed line, indicating at what point seasonal atmospheric water demand equals supply.
The modeled yields were estimated in each state using process-based agro indices fit to observed historical yield data, and then losses were derived using assumed coverage levels. The grid-level losses were aggregated to derive state-level average loss costs (i.e., actual losses or sums insured) for theoretical insurance portfolios.
State-level average annual loss costs (AALC) were estimated for soybean during the historical reference period. Loss cost anomalies for 2021–22 were also calculated relative to the AALC for all years and for La Niña years only.
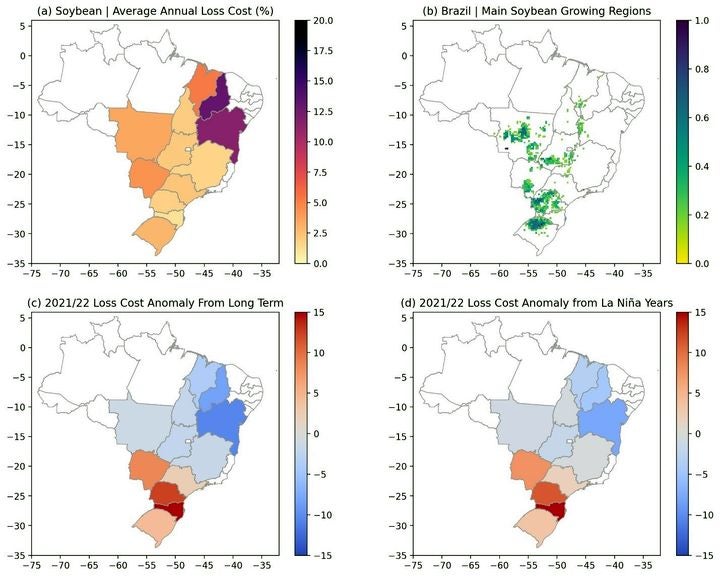
As seen in Figure 4, the modeled loss costs in southern states during 2021–22 are substantially higher than their long-term mean values (about five standard deviations higher in Santa Catarina and Paraná), which is in line with reported observations from government statistics and reinsurers.
The losses for southern states in 2021–22 were also substantially higher than the mean historical loss costs in La Niña years only. This suggests that the 2021–22 drought during the cropping season in southern Brazil was indeed a rare occurrence, as captured by the RMS Brazil Agricultural Model.
Figure 4: (a) Soybean state-level AALC (from 1980–2018) based on theoretical exposure, shown for those states that have grid cells with at least 5,000 tons of mean annual production; (b) fraction of soybean harvested area within 25 kilometer grid cell (shown for grid cells with at least 15 percent coverage); (c) state-level departure in 2021–22 growing season from the long-term AALC; and (d) state-level departure in 2021-22 growing season from the AALC in La Niña years only
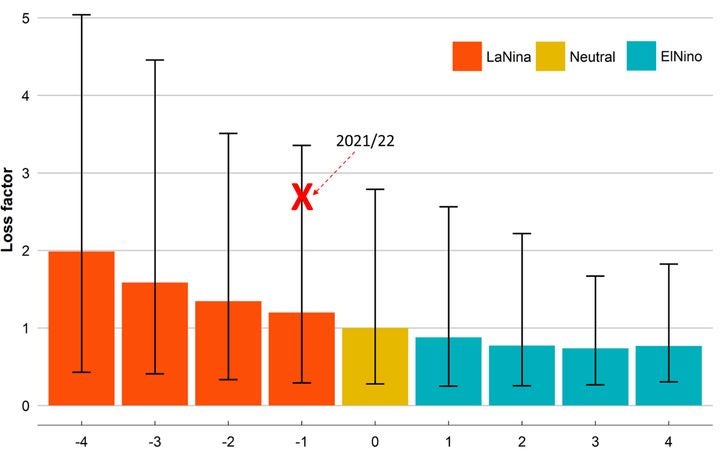
The RMS Brazil Agricultural Model is also capable of modeling losses for simulated stochastic weather years to present a full view of risk at the portfolio level at crop, state, and municipality resolutions. Figure 5 shows the variation and range in the loss ratio of a pseudo-portfolio for soybean (growing areas in Figure 4b) across multivariate ENSO index (MEI) values from –4 (La Niña) to 4 (El Niño).
This shows that La Niña years (negative MEI) are particularly problematic for portfolios with southern-state exposures, with loss ratios up to two times higher than neutral for the most severe La Niña events, albeit with large uncertainties. Yet even within the range and variation of simulated stochastic weather across ENSO states, this year’s loss costs were indeed anomalous, at nearly three times what is expected for neutral conditions.
Figure 5: Loss factor at each MEI value (relative to expected losses at MEI = 0 or neutral conditions). Losses are modeled for a soybean pseudo-portfolio in the soybean growing areas shown in Figure 4b across 51,000 stochastic weather years, with 95 percent confidence intervals shown for each index value. Soybean loss ratios (i.e., premiums collected/sums insured) at each MEI value (i.e., ENSO state) divided by expected loss ratio at MEI = 0 (or neutral conditions).
Most of this production occurs in the central region of the country, and with area expansion into intact forests, this again exacerbates warming and drying trends in downwind areas. Thereby, this increases the likelihood and severity of future droughts in southern Brazil.2
As discussed in this blog, the RMS Brazil Agricultural Model can provide (re)insurers with in-depth analysis and insight into their agriculture portfolio risk across the spectrum of seasonal weather conditions and in the face of increasingly extreme weather expected across the globe. With state-of-the-art climate and crop science embedded in the methodology, the RMS model can add significant value to risk assessment capabilities of relevant organizations.
1 Funk, C., Peterson, P., Landsfeld, M., Pedreros, D., Verdin, J., Shukla, S., Husak, G., Rowland, J., Harrison, L., Hoell, A., & Michaelsen, J. (2015, December 8). The climate hazards infrared precipitation with stations—a new environmental record for monitoring extremes. Scientific Data, 2, 150066. https://doi.org/10.1038/sdata.2015.66;
Hersbach, H., Bell, B., Berrisford, P., Biavati, G., Horányi, A., Muñoz Sabater, J., Nicolas, J., Peubey, C., Radu, R., Rozum, I., Schepers, D., Simmons, A., Soci, C., Dee, D., Thépaut, J-N. (2018, June 14). ERA5 hourly data on single levels from 1959 to present. Copernicus Climate Change Service (C3S) Climate Data Store (CDS). https://doi.org/10.24381/cds.adbb2d47
2 Arraut, J. M., Nobre, C., Barbosa, H. M. J., Obregon, G., & Marengo, J. (2012, January 15). Aerial rivers and lakes: Looking at large-scale moisture transport and its relation to Amazonia and to subtropical rainfall in South America. Journal of Climate, 25(2), 543–556. https://doi.org/10.1175/2011JCLI4189.1
Navin leads the Emerging Risk model development team since March 2021, and is responsible for the development and deployment of risk models and products in a variety of areas including longevity risk, casualty, infectious disease and pandemic risk, terrorism and political risk, business interruption, supply chain, liability risk, agriculture risk and systemic risk.
Prior to this role, he was the head of agriculture risk products at RMS and led the property natural catastrophe vulnerability development team in the RMS London office for over 14 years, covering models in Europe and Asia-Pacific including Australia.
Prior to joining RMS, Navin worked as a geo-seismic engineer with over nine years of consulting experience with Arup in London and Hong Kong. He has received his master's (First Class) in engineering and a Ph.D. in seismic engineering from the University of Cambridge. He is a Chartered Engineer with the Institution of Civil Engineers in London, a Member of the American Society of Civil Engineers, and a certified catastrophe risk analyst.
Sharon joined RMS in May 2022 to help lead agricultural model development activities. She formerly worked at the U.S. National Institute of Standards and Technology, developing models to better separate biospheric and anthropogenic signals of carbon dioxide in the atmosphere. Sharon has also worked at the International Center for Tropical Agriculture (CIAT) in Cali, Colombia, where she led the crop and climate modeling group focused on improving decision support for agriculture in the region.
She holds a Ph.D. in Environmental Engineering from the University of Michigan and has completed a post-doc at Stanford University in climate change and agriculture.
Ashutosh Pandey
Senior Modeler, Emerging Risks
Ashutosh has been working in the catastrophe risk modeling industry for the last 5 years, in a research and development role at RMS examining emerging risks related to climate and agriculture.
He completed his masters degree in Climate Science from the Indian Institute of Science, Bengaluru, and earned his B.E. (Honours) in Mechanical Engineering from the Birla Institute of Technology and Science in Pilani (India).