Three Questions on the December 2022 North America Cold Air Outbreak
Mubashshir AliJanuary 16, 2023
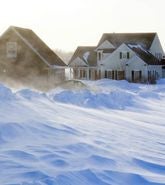
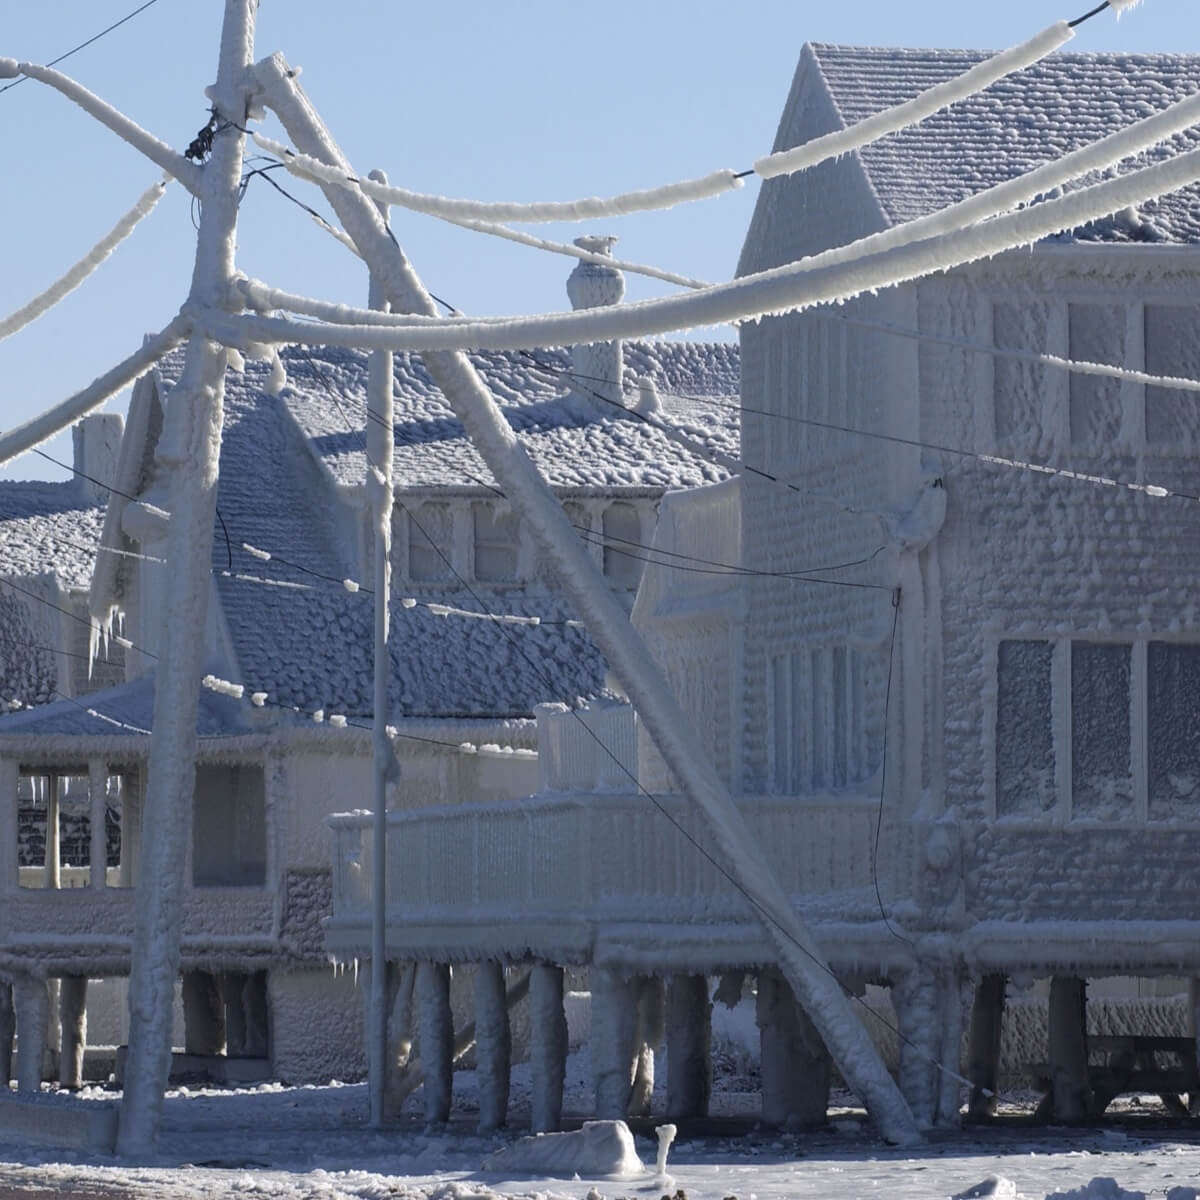
The 2022 holiday season was greeted by a cold air outbreak (CAO) between December 21–27, 2022, with winter storms bringing freezing temperatures, snow, and strong winds across northern, central, southern, and eastern U.S. and Canada.
As noted in the RMS Event Response summary, Buffalo, New York hit the headlines when lake effect snow (snow that forms downwind of large bodies of water) and strong winds caused blizzard conditions for 37.5 hours and resulted in the city being snowed-in and isolated for several days
According to media reports, at least 91 fatalities have been reported across 19 U.S. states and Canada due to either cold exposure, vehicle accidents, electrocution, or carbon monoxide poisoning. 40 of those fatalities are reported in Buffalo, New York.
The event caused significant transport disruption across the U.S. and Canada. More than 18,000 flights were canceled or delayed, railway services were widely suspended or canceled, and many areas issued 'do not travel' warnings due to the dangerous conditions.
More than 2.6 million people across the U.S. and Canada were without power at some point during the event. For a more detailed summary of this event, clients can refer to the previously released RMS Event Response summary on RMS Owl.
The CAO was certainly an exceptional event, and in this blog, we discuss three questions:
What led to this CAO?
How did this CAO compare to the CAO and winter storm that had a severe impact on Texas in February 2021?
Is it a climate change signal that two CAOs occurred over North America in two consecutive years?
What Led to this Cold Air Outbreak? A Meteorological Summary
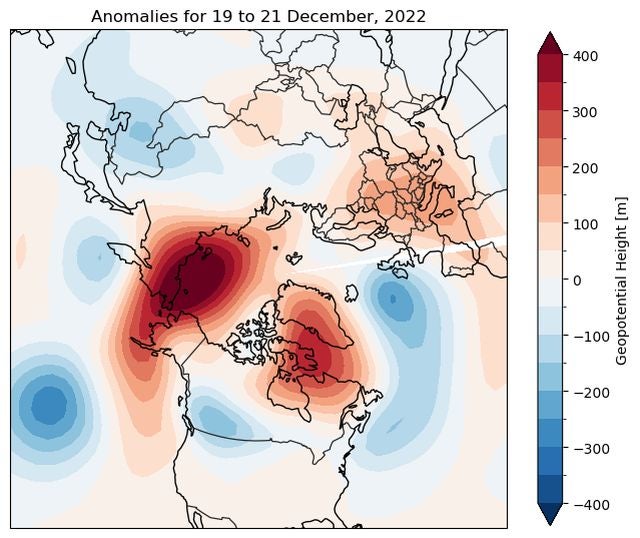
The December 2022 CAO was caused by the displacement of cold Arctic air masses to lower latitudes. Prior to the outbreak, warm air masses from lower latitudes got advected into the Arctic and formed a high-pressure system over the Siberian Arctic. Simultaneously, a high-pressure system was present over Greenland (Fig. 1). These two systems helped to channel cold Arctic air into the U.S. and Canada. Such a pattern is often seen in the CAOs over the U.S. (Millin et al. 2022).
Figure 1: Geopotential height anomalies composite map relative to the climatology at 500 hPa for December 19–21, 2022 prior to the CAO.
The resulting cold air came in close vicinity with warm and moist air originating from the Gulf of Mexico. The strong temperature gradient between the cold and warm air masses and the available moisture provided the ingredients for bomb cyclogenesis (i.e., rapid deepening of the low in a 24-hour period) over the eastern U.S. This strong low-pressure area combined with the relatively warmer waters in the eastern Great Lakes and produced massive snowfall in the states of New York and Michigan.
CAOs are often associated with a weaker and more meandering trend of the jet stream, a band of high-speed air around 10–15 kilometers above ground that helps to steer low-pressure systems in the mid-latitudes. The jet stream can oscillate back and forth between periods of strong, narrow winds and weaker and more meandering winds.
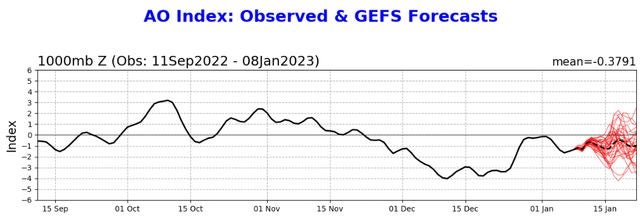
This oscillation between a weaker and stronger jet stream is captured by the Arctic Oscillation (AO) index, where a negative AO implies a weaker jet stream. CAOs are likely to be more frequent and severe during negative AO periods (Huang et al. 2021; Smith and Sheridan, 2018). The December 2022 outbreak also occurred during negative AO (Fig. 2).
Figure 2: Negative AO observed during the period of the December 2022 CAO and forecasted using the Global Ensemble Forecast System (GEFS). Figure source: Climate Prediction Center, National Weather Service.
Comparison with the 2021 February CAO
The February 2021 CAO and winter storms were the costliest winter event on record with an estimated loss of US$9 billion to US$15 billion, with freeze being the main loss driver, especially across Texas.
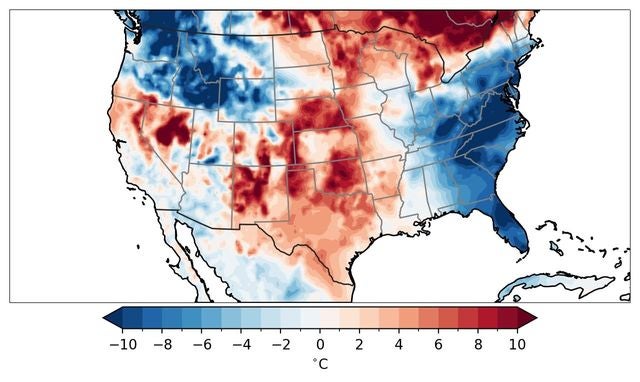
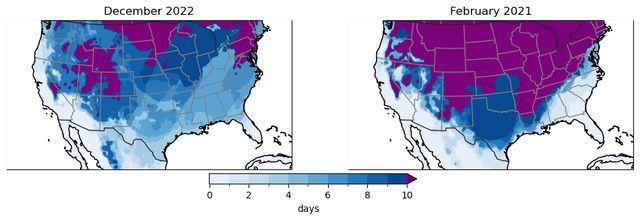
The December 2022 CAO recorded more intense temperatures over parts of the western and central U.S. compared to the February 2021 CAO (Fig. 3); however, the 2022 CAO was short-lived. For Texas, the 2022 event produced three to four days of consecutive freeze compared to eight to ten days for the 2021 event (Fig. 4). Because of the shorter length of the 2022 event, losses stemming from the freeze hazard should be significantly reduced.
Figure 3: Difference in the coldest temperature recorded between the December 2022 CAO and the February 2021 CAO. Red colors show areas where December 2022 event was warmer. Data source: ERA5 ReanalysisFigure 4: Consecutive freezing days (i.e., days below zero degree Celsius) for the two events.
As evidenced by the February 2021 CAO event, freezing temperatures in lower latitudes are more problematic than in middle or upper latitudes as the infrastructure in these areas is less prepared for such extreme events.
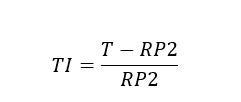
Taking this into consideration, RMS models represent freeze hazard as a Temperature Index (TI), which takes local climatology into account. TI is calculated from the most extreme daily minimum Temperature (T) recorded for the event, where the anomaly of T is calculated from the two-year return period, RP2, and normalized by RP2:
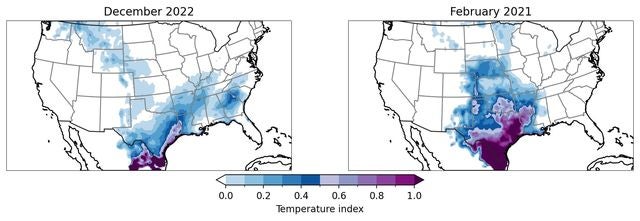
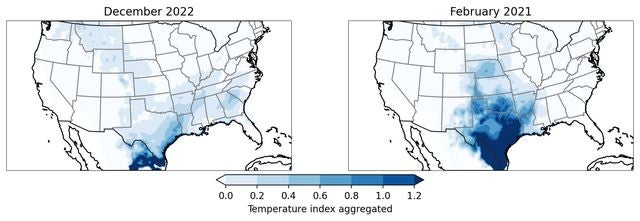
Figure 5 shows that TI values were lower and more widespread over the central and eastern U.S. for the February 2021 event. The 2021 event was most damaging over Texas, which our TI map captures very well. The aggregated TI over the duration of the two events shows that the February 2021 event was longer-lived and, as a result, caused more freeze-related damages.
Figure 5: Temperature Index (TI) calculated with respect to the coldest temperature recorded for the two CAOsFigure 6: Temperature Index (TI) aggregated over the period of the two CAOs.
Additionally, other hazards were experienced with the February 2021 event that did not occur in the 2022 event. Six tornadoes with a maximum rating of EF3 were experienced during the February 2021 event, whereas no tornadoes were observed during the 2022 event. The 2022 event recorded more snowfall; however, it occurred across the Snowbelt region of the eastern Great Lakes, where lake-effect snow events are quite frequent and local infrastructure is better prepared to deal with snow events.
Cold Air Outbreaks and the Role of Climate Change
With two extreme CAOs in successive years, it begs the question about the role of climate change in CAOs. Data from 1979–2018 show that the frequency and duration of CAOs have decreased in the eastern U.S. and Canada (Smith and Sheridan, 2018). However, it is unclear whether the change is due to internal variability or external factors such as climate change.
Moreover, climate model projections using five models show that CAOs may remain persistent through 2040 under three different socioeconomic pathways (SSPs) SSP126, SSP245, and SSP585. CAOs are projected to disappear beyond 2054 in those models based on current temperature percentile-based definitions (Smith and Sheridan, 2021).
It is worth noting that other model experiments give divergent conclusions on the influence of the warming Arctic on the midlatitude severe winter weather (Cohen et al., 2020).
Click here to find out more about RMS Winterstorm models.
References
Cohen, J., Zhang, X., Francis, J. et al. Divergent consensuses on Arctic amplification influence on mid-latitude severe winter weather. Nature Clim. Chang. 10, 20–29 (2020).
Huang, J., Hitchcock, P., Maycock, A.C. et al. Northern hemisphere cold air outbreaks are more likely to be severe during weak polar vortex conditions. Nature Commun. Earth Environ. 2, 147 (2021).
Millin, O. T., Furtado, J. C., & Basara, J. B. Characteristics, Evolution, and Formation of Cold Air Outbreaks in the Great Plains of the United States, Journal of Climate, 35(14), 4585-4602 (2022).
Smith, E. and Sheridan, S. The influence of atmospheric circulation patterns on cold air outbreaks in the eastern United States. International Journal of Climatology, 39(4), (2018).
Smith, E. and Sheridan, S. Projections of cold air outbreaks in CMIP6 earth system models. Climatic Change, Springer 169 (2021).
Model Developer, Severe Weather and Climate Hazard
Mubashshir is a model developer focused on severe weather and climate hazard. He has an extensive background in atmospheric dynamics. Prior to joining Moody's RMS, he completed his Ph.D. in climate science from the University of Bern, where he researched the role of recurrent Rossby waves in driving extreme weather.
He has a master’s degree in environmental physics from the University of Bremen, and a master’s and a bachelor’s degree in geophysics from IIT Kharagpur.