Key Takeaways
- More detailed exposure map that included previously underestimated flood risk
- More accurate weighting of exposure based on multiple gridded points for panels and additional single points for the switchyard and substations, rather than a single centroid
- Better risk selection with customized view of defended and undefended losses
The Challenge – Analyzing the Range of Exposures Across a Major Rail Network
A large Lloyd’s syndicate needed to establish a comprehensive risk profile for an extensive North American rail network, which spanned over 1,000 miles of track and covered a wide range of topographies.
The complexities inherent in the rail network made it extremely challenging to model effectively. Traditionally, when dealing with linear risks, such as railway systems or road infrastructure, a total value is applied to the risk, and the network is defined by the geographical start and end points with the value attributed equally between them.
Treating this composite setting as a single risk spanning two points offered only a base level of understanding of the exposure. It gave limited insight into the multiple vulnerability components in the network, such as rail tracks, maintenance of way machinery, rolling stock, stations, power substations, bridges, tunnels, and control rooms.
Moody’s RMS Analytical Services recommended breaking the network down into risk components for a more accurate view of risk. This way, the network could be modeled in its entirety with accurate exposure values for the linear features across the entire railway system.
The Solution – Applying a Linear Risk Modeling Methodology to Quantify the ExposureThe Solution – Applying a Linear Risk Modeling Methodology to Quantify the Exposure
Moody’s RMS Analytical Services offered a unique advantage to the insurer. The Analytical Services team had previously developed a proprietary linear risk modeling methodology designed to disaggregate a single risk, such as a rail network, into its primary individual exposures.
Phase 1: Linear Exposure Breakdown
This phase began by breaking down the entire network into point features, called points of interest (POI) or risk items. Initially, locations were created using rail stations’ address information along with the network. However, for a more granular breakdown of the network’s linear geographic spread, the team adopted licensed geographic information system (GIS) software, a rail network map, and Moody's RMS proprietary exposure modeling methodology.
By combining equidistant segmenting, variable resolution grid (VRG) intersection, and VRG centroid methods, the team established separate layers for each type of linear feature (such as rail, power distribution, bridges, tunnels, etc.) and floating exposure (such as rolling stock, way-machinery maintenance, etc.). All such layers were plotted on Arc GIS/QGIS and exported in the form of POI/risk items.
Phase 2: Exposure Value Allocation and Coding
This detailed undertaking enabled the team to create a comprehensive exposure map for the entire network. Specific coding was applied to the distinct types of exposure to allow for modeling with accurate vulnerability, indicating location, construction type, and occupancy type.
By modeling each risk component across the map, the team was able to generate a range of accurate exposure values for the rail system. This included weighted values for complex parts where the rail lines intersected or had a dense layout, such as yards and maintenance facilities. Rolling stock was split into a 75-to-25 ratio, assuming approximately 25 percent always remained in yards for maintenance and contingency, and 75 percent was spread across the network.
The Outcome – More Complete View of Risk Improves Pricing
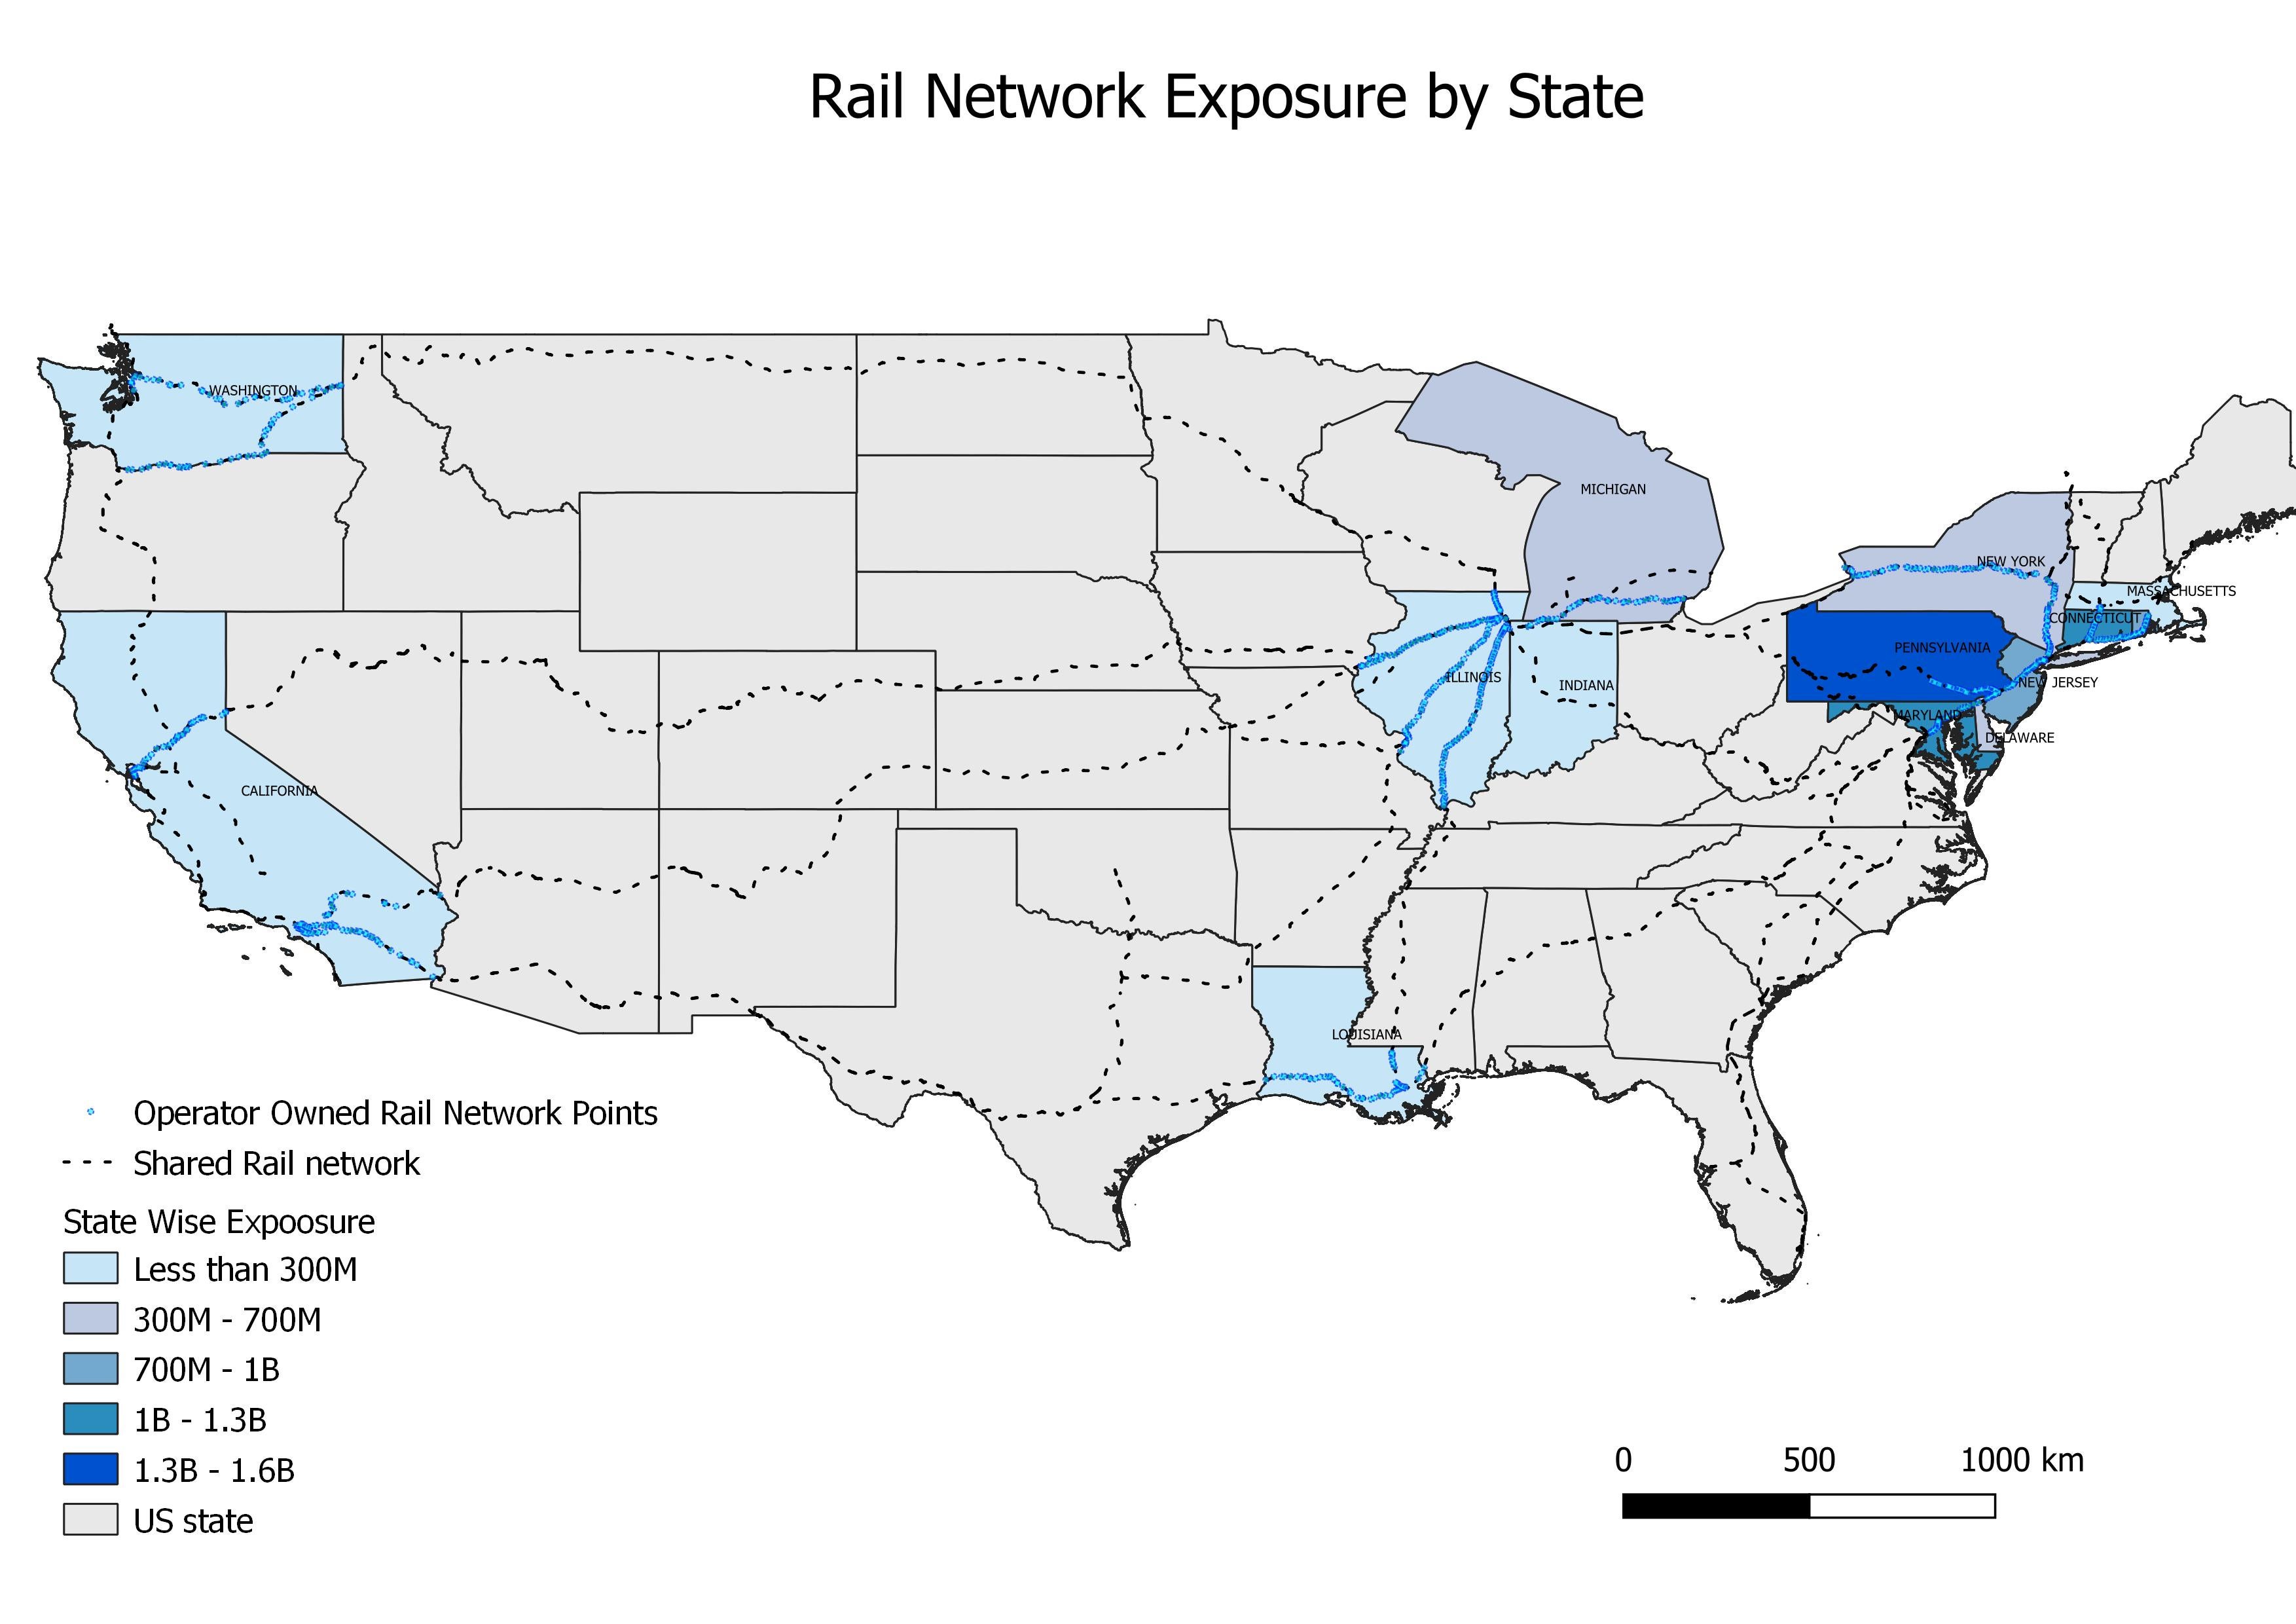
The exposure map for the rail network provided the insurer with a far more granular understanding of the entire infrastructure’s risk profile than had previously been possible.

Armed with this modeled data insight, the insurer was able to establish a more accurate premium level for the risk based on the individual exposure values, while adjusting average annual loss (AAL) figures across different perils more effectively. The enhanced risk view supported a more targeted risk syndication strategy.

From a loss perspective, in the event of an incident affecting one station or part of a line, the insurer would be able to quickly generate accurate insured loss based on exposure values specific to the location.


