From Arlene to Zeta: Remembering the Record-Breaking 2005 Atlantic Hurricane Season
Brian OwensAugust 17, 2015
Few in the insurance industry can forget the Atlantic hurricane season of 2005. For many, it is indelibly linked with Hurricane Katrina and the flooding of New Orleans. But looking beyond these tragic events, the 2005 season was remarkable on many levels, and the facts are just as compelling in 2015 as they were a decade ago.
In the months leading up to June 2005, the insurance industry was still evaluating the impact of a very active season in 2004. Eight named storms made landfall in the United States and the Caribbean (Mexico was spared), including four major hurricanes in Florida over a six-week period. RMS was engaged in a large 2004-season claims evaluation project as the beginning of the 2005 season approached.
An Early Start
The season got off to a relatively early start with the first named storm—Arlene—making landfall on June 8 as a strong tropical storm in the panhandle of Florida. Three weeks later, the second named storm—Bret—made landfall as a weak tropical storm in Mexico. Although higher than the long-term June average of less than one named storm, June 2005 raised no eyebrows.
July was different.
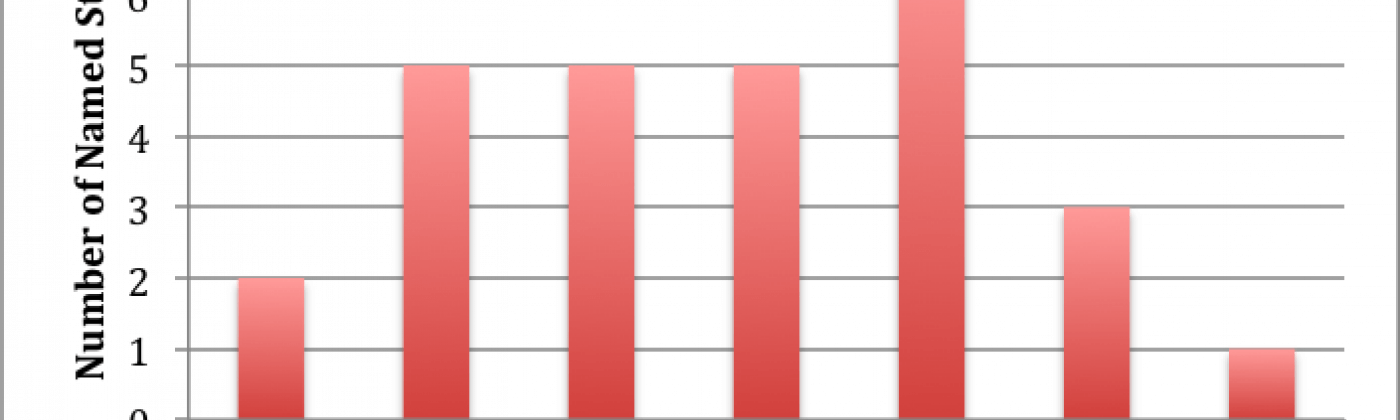
Climatologically speaking, July is usually one of the quietest months of the entire season, with the long-term average number of named storms at less than one. But in July 2005, there were no fewer than five named storms, three of which were hurricanes. Of these, two—Dennis and Emily—were major hurricanes, reaching categories 4 and 5 on the Saffir-Simpson Hurricane Scale. Dennis made landfall on the Florida panhandle, and Emily made landfall in Mexico. This was the busiest July on record for tropical cyclones.
The Season Continued to Rage
In previous years when there was a busy early season, we comforted ourselves by remembering that there was no correlation between early- and late-season activity. Surely, we thought, in August and September things would calm down. But, as it turned out, 10 more named storms occurred by the end of September—five in each month—including the intense Hurricane Rita and the massively destructive Hurricane Katrina.
In terms of the overall number of named storms, the season was approaching record levels of activity—and it was only the end of September! As the industry grappled with the enormity of Hurricane Katrina’s devastation, there were hopes that October would bring relief. However, it was not to be.
Seven more storms developed in October, including Hurricane Wilma, which had the lowest-ever pressure for an Atlantic hurricane (882 mb) and blew though the Yucatan Peninsular as a category 5 hurricane. Wilma then made a remarkable right turn and a second landfall (still as a major hurricane) in southwestern Florida, maintaining hurricane strength as it crossed the state and exited into the Atlantic near Miami and Fort Lauderdale.
We were now firmly in record territory, surpassing the previous most-active season in 1933. The unthinkable had been achieved: The season’s list of names had been exhausted. October’s last two storms were called Alpha and Beta!
Records Smashed
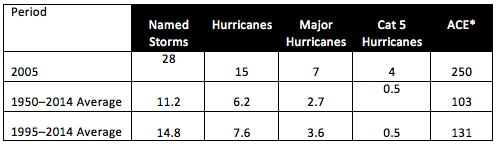
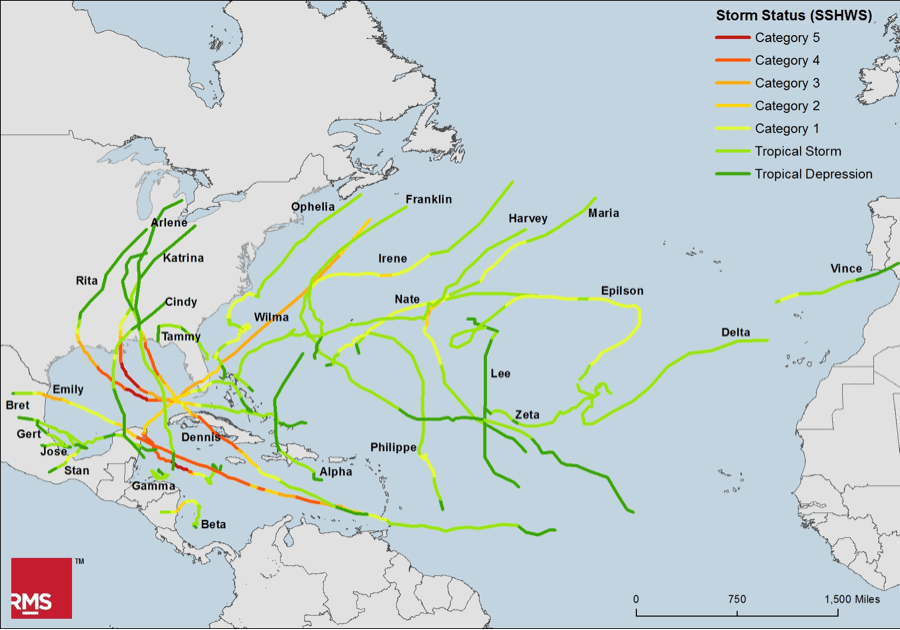
Four more storms were named in November and December, bringing the total for the year to 28 (see Figure 1). By the time the season was over, the Atlantic, Caribbean and Gulf of Mexico had been criss-crossed by storms (see Figure 2), and many long-standing hurricane-season records were shattered: the most named storms, the most hurricanes, the highest number of major hurricanes, and the highest number of category 5 hurricanes (see Table 1). It was also the first time in recorded history that more storms were recorded in the Atlantic than in the western North Pacific basin. In total, the 2005 Atlantic hurricane season caused more than $90 billion in insured losses (adjusted to 2015 dollars).
The 2005 Atlantic Hurricane Season: The Storm Before the Calm
The 2005 season was, in some ways, the storm before the current calm in the Atlantic, particularly as it has affected the U.S. No major hurricane has made landfall in the U.S. since 2005. That’s not to say that major hurricanes have not developed in the Atlantic or that damaging storms haven’t happened—just look at the destruction wreaked by Hurricane Ike in 2008 (over $13 billion in today’s dollars) and by Superstorm Sandy in 2012, which caused more than $20 billion in insured losses. We should not lower our guard.
Figure 1: Number of named storms by month during the 2005 Atlantic hurricane seasonTable 1: Summary of the number of named storms in the Atlantic hurricane basin in 2005 and average season activity through 2014
* Accumulated Cyclone Energy (ACE): a measure of the total energy in a hurricane season based on number of storms, duration, and intensity
Figure 2: Tracks of named storms in the 2005 Atlantic hurricane season
When you consider lofty odds like the chances you will win the Mega Million lottery (1 in 259 million) or the chance you will get hit by lightning (1 in 280,000) it blunts your appreciation of very unlikely, if not statistically improbable, events.
Consider some of the things with 500-to-1 odds:
An Auburn fan bet that his team would win the NCAA football national championship. He came close to a $50k payday but ultimately missed the mark.
Pro golfer Rory McIlroy’s father bet his son would win the British Open by 25 at 500-1 odds and won $171k.
One lucky European better predicted Germany would stomp Brazil 7-1 in the World Cup and won.
We witnessed something that has a 500-1 chance of happening recently in nature: two storms hit Bermuda within six days of each other. Bermuda was recently hit by a tropical storm (Fay) and a borderline category 2/3 hurricane (Gonzalo) within six days. The chances of two tropical systems hitting what amounts to a tiny dot in the middle of Atlantic Ocean this year was 1-in-500 according to our modeling.
Not statistically improbable, but certainly not a normal occurrence.
Even more impressive, the natural fluke comes after a relatively inactive hurricane season. There have been seven named storms in 2014; six have reached hurricane status.
The climatological peak of the Atlantic season for hurricanes is mid-September and generally associated with storms that develop as they cross from Africa toward the Caribbean. However, there is a secondary peak in October related to storms developing closer to the U.S. in areas such as the Caribbean Sea and the Gulf of Mexico.
The cumulative intensity of this season’s storms is lower than average. Our research attributes this to cooler than normal sea temperatures in the Atlantic lessening energy, along with higher than normal sea pressures suppressing thunderstorms. It would be interesting to see what the odds were for Gonzalo and Fay both hitting Bermuda if we factored in a slow hurricane season.…
Hawaii Narrowly Escapes Hurricane Landfalls in the Midst of an Active Season
Hawaiians held their breath early this month as not one but two hurricanes made their way toward the islands, following similar tracks. Hurricane Iselle was the second and strongest tropical storm on record to make landfall over Hawaii’s Big Island, and though it caused localized flooding, knocked out power to thousands of homes, and took down trees, it did not cause any major damage or injuries. Iselle was followed closely by Hurricane Julio, the fourth major hurricane to form in the East Pacific Ocean so far this year, which bypassed the islands altogether. The Hawaiian Islands were spared once again.
This was not surprising. Storms such as Iselle and Julio, which tracked directly east to west from the East Pacific, typically become disorganized before reaching the islands due to the cool waters and dry air that lie to the east. Hurricanes approaching from the south represent the biggest threat to the islands, due to the warmer waters and more unstable air to the south.
Prior to Iselle, only two hurricanes had made landfall over the Hawaiian Islands since 1949. In 1959, Hurricane Dot tracked from the south and made landfall as a Category 1 storm. In 1992, Hurricane Iniki formed just inside the East Pacific and tracked west into the Central Pacific. It remained well south of the islands and then curved north, making landfall as a Category 4 storm. Both systems made landfall over the island of Kauai, located to the far west of the Hawaiian Island chain.
Nonetheless, Hawaiians and insurers should keep a watchful eye on the weather in the East Pacific. Hurricane season in the East Pacific basin, which officially runs from May 15 to November 30, has so far been characterized by above average activity with 10 named storms, 5 hurricanes, and 3 major hurricanes. The NHC’s 1971-2009 average by August 7th is 7 named storms, 3 hurricanes, and 1 major hurricane.
Activity in the Central Pacific is closer to normal levels. According to the CPHC, between 1971 and 2013, an average of four or five tropical cyclones were observed in the region each hurricane season, which runs from June 1 to November 30. Activity ranged widely from no cyclones in 1979 to as many as 11 cyclones in 1992 and 1994.
While it is rare for hurricanes to make landfall in Hawaii, events such as Iselle and Julio are a reminder that even in paradise there is potential for natural catastrophe loss.…
Brian Owens is a meteorologist and specialist in catastrophe risk management. At RMS he is responsible for market engagement and product strategy for the European and North America models.
Brian has more than 15 years’ experience in insurance, catastrophe financing and catastrophe risk management and has held senior positions at JP Morgan Chase, ACE European Group and Willis Re. He is also a published science author, and has written numerous articles and blogs on catastrophe risk modeling and management.
Brian holds a bachelor’s degree in computer science from the National University of Ireland, a master’s in finance from the Wharton School, University of Pennsylvania, and a master’s in meteorology from the Rosenstiel School of Marine and Atmospheric Science, University of Miami.