On the morning of Tuesday, September 19, people across Mexico had taken part in the annual national earthquake drill and other remembrance activities, to commemorate 32 years since the 1985 Mw8.0 Michoacán Earthquake. Michoacán was the most devastating earthquake in Mexico’s history, leaving at least 9,500 people dead and more than 100,000 homeless.
No one could have imagined at the time of these drills that a little more than two hours later, at precisely 1:14 pm local time (CDT), they’d be experiencing a real earthquake, the same day as Michoacán, as the Mw7.1 “Puebla” earthquake struck Mexico City and surrounding states. The improbable had become reality.
RMS estimates that the Puebla earthquake caused between US$4 billion and US$8 billion in economic property losses and as much as US$1.2 billion in insured property losses. This estimate accounts for shake-only losses to building, contents and business interruption, including the effects of liquefaction and landslides.
Ground Motion Amplification in the Mexico City Basin
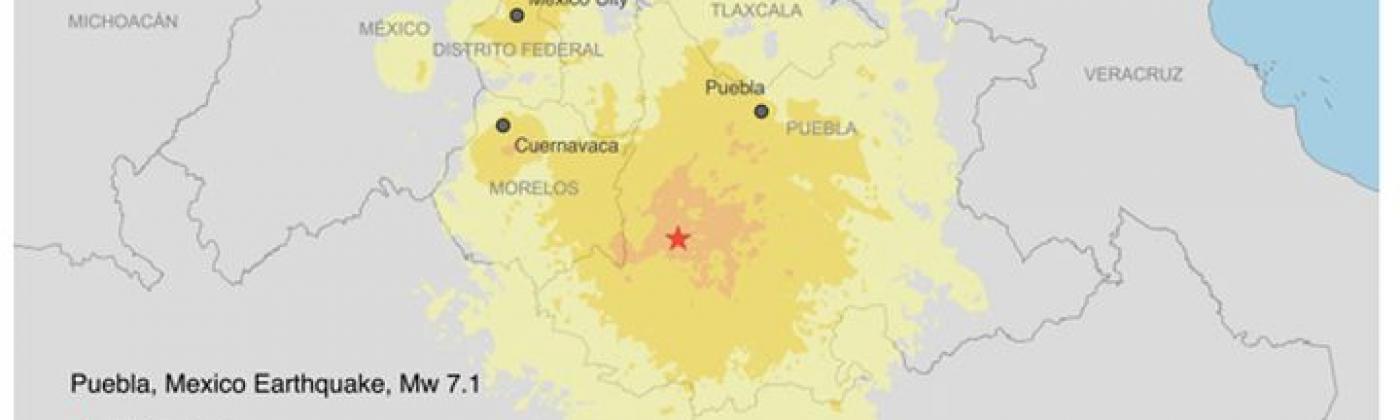
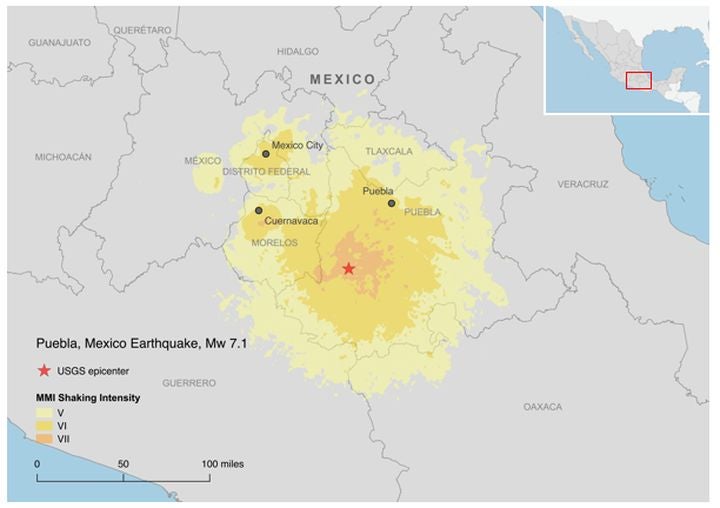
Just as in 1985, this Mw7.1 earthquake caused the heaviest damage and loss of life in the country’s capital, despite the epicenter being nearly 75 miles (120 kilometers) away. Much of Mexico City, including many of its most historic neighborhoods, is situated on a former lakebed and underlain by deep deposits of soft soils that form part of what is known as the Mexico City Basin. The basin significantly amplifies and lengthens the duration of seismic ground motions.
This was evident in the 1985 event, where spectral acceleration — a measure of shaking intensity — was amplified more than five times (depending on the building height) in many locations within the basin, compared with rock sites. We cannot yet say definitively how much ground motions were amplified in Mexico City during the Puebla earthquake — researchers need more time to process the observed ground motion recordings — but we can say with high certainty that basin amplification was triggered and that it contributed to the losses.
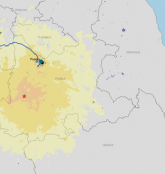
Figure 1: Map of areas affected by the Puebla, Mexico earthquake based on the USGS ShakeMap v5
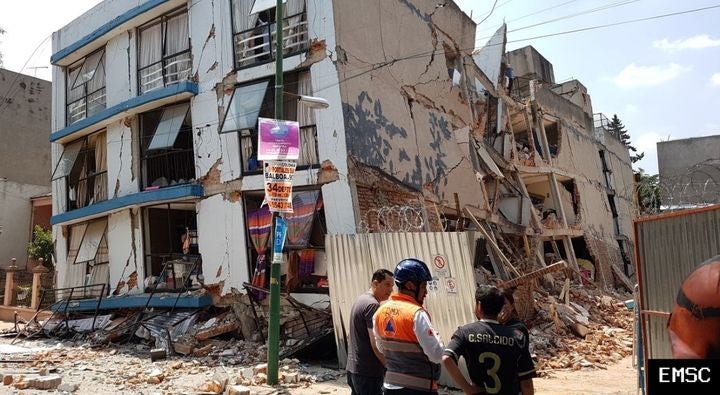
More than 50 buildings collapsed or were severely damaged in Mexico City, with the boroughs of Cuauhtémoc, Benito Juarez, Coyoacán and to a lesser extent Tlalpan and Xochimilco bearing the brunt of the loss. Many of these buildings; schools, offices, apartment blocks, were constructed of reinforced concrete frames with unreinforced masonry infill walls. This is a structural system that is widely known to be vulnerable during earthquakes unless special care is taken in its seismic design. These building collapses led to most of the fatalities and some of the most severe cases of property loss, attracting global attention.
Confined masonry buildings, a common structural system for homes and small businesses, were also damaged. But in the coming days we should expect to learn more about building damage that was less life threatening — such as cracks in interior partition walls, flooring, and windows or broken mechanical and electrical systems. Damage to these “non-structural” components will likely contribute significantly to the overall economic and insured losses from this earthquake.
Figure 2: Many of the most heavily damaged buildings in Mexico are constructed with reinforced concrete frames with unreinforced masonry infill walls. Image Credit: European-Mediterranean Seismological Center
Mexico has a long history of mandatory seismic-resistant design. This started with the 1957 building code for Mexico City that, among other things, set limits on the allowable lateral movement of structures during ground shaking. Over the years the code has improved, often spurred by lessons learned from earthquakes. For example, more stringent seismic requirements were implemented following the 1985 Michoacán Earthquake, with particular attention to reinforced concrete frame buildings.
But as is common around the world, Mexico’s code does not mandate that older structures be retrofitted, leaving a large stock of vulnerable buildings across the country. Based on initial reports, it appears that many of the collapsed buildings are older vintage between three and seven stories tall. Other affected buildings, while perhaps built after 1985, are of a modest size and profile, making it more likely that structural design and code enforcement were lacking.
Additionally, the shorter distance from the epicenter for the Puebla earthquake compared to the 1985 event appears to have contributed to the increased damage to mid-rise buildings compared to taller buildings (typically 8-18 stories) that dominated collapses in the 1985 earthquake.
Mapping Collapsed Buildings in Mexico City
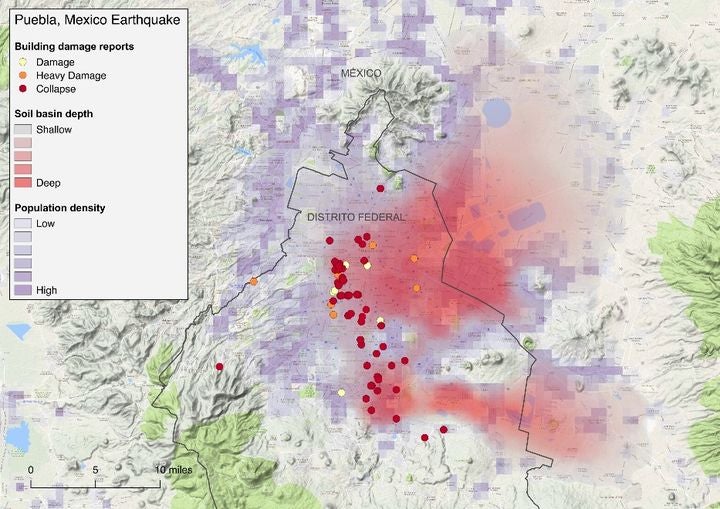
A map of population density overlain with the extent and depth of the Mexico City Basin, and the location and severity of damaged buildings from the Puebla earthquake (see Figure 3 below), highlights the linkages between these variables. The collapsed buildings are nearly all within the basin and are also in areas of high population density. While not evident from the map, these hardest hit areas — such as the neighborhoods of Roma Norte, Condesa, and Centro Histórico — are also some of the oldest developments in the city.
Figure 3: Map showing the extent and depth of the Mexico City Basin, population density, and the location of damaged buildings. The location and severity of damaged buildings is based on reports from Mexican governmental agencies.
The earthquake has affected more than just Mexico City. Collapsed buildings and damage have also been reported in the cities of Puebla and Cuernavaca and small cities across the states of Puebla, Morelos, and Mexico. Initial reports show many of the impacted buildings to be constructed of unreinforced masonry. In fact, RMS estimates that about 50 percent of the total economic value of buildings that experienced shaking intensities of MMI 5.5 or greater was outside Mexico City.
The 1985 earthquake was a subduction interface event, occurring at the junction between the colliding Cocos and North American plates. This boundary occurs along the west coast of Mexico. In contrast, the Puebla earthquake occurred within the subducting Cocos plate and originated at a depth of about 32 miles (51 kilometers). Because it was generated within the Cocos plate, which subducts steadily eastwards towards the Caribbean, the epicenter was about 155 miles (250 kilometers) from Mexico’s west coast, placing it much closer to Mexico City than the Michoacán event.
But Puebla’s smaller magnitude, coupled with improvements in the country’s building stock, have meant that this earthquake, while destructive, will not surpass the losses, either in economic, insured or human terms, caused by its forebearer, the 1985 Michoacán Earthquake.
Share:
You May Also Like
November 13, 2017
Puebla Earthquake: New Insights from RMS Reconnaissance
This blog is a reprint of an article published in Canadian Underwriter
New insights often challenge the established view. The view of earthquakes in Canada is changing, including shifts in the seismic risk within the greater Metro Vancouver area and in the balance of seismic risk between the east and west.
Starting with Metro Vancouver, insured seismic risk was previously viewed as being more heavily concentrated in the city proper, given the exposure concentration, including a prevalence of high-value buildings. But based on insights, the product of a new RMS model focused on earthquake risk in Canada, it appears insured seismic risk is driven more by exposure in the expansive region to the south of Vancouver, which straddles the main arm of the Fraser River.
Why is this region in focus? It is worth examining how it was created. For thousands of years, the Fraser River carried sand, silt, and other sediments westward towards the Georgia Straight, helping to create a network of islands. Today, these islands and their surroundings are home to the fast-growing City of Richmond, the Vancouver International Airport, Deltaport container terminals and more, all of which sit on top of what geologists call a sedimentary basin. The portion of the basin to the south of Vancouver, call it the Vancouver Basin, has deposits of soft soils as deep as 300 meters.
The Vancouver Basin accounts for about 10 percent of the total earthquake-exposed value within British Columbia, but contributes about 20 percent of the province’s modeled insured (or gross) average annual loss and 500-year return period loss (for this particular article, earthquake-exposed value — that is, after taking into account penetration rates, but before applying policy terms — and modeled loss considers all lines of business and coverages, although not high-value specialty occupancies, such as power plants, which were removed to generate results that reflect more typical insurance portfolios).
In contrast, the City of Vancouver accounts for about 13 percent of British Columbia’s total earthquake-exposed value while contributing about 15 percent of the modeled insured average annual loss and 500-year return period loss.
Key Considerations
It is tempting to attribute this shift to differences in growth patterns between the City of Vancouver and the Vancouver Basin. But analysis indicates the new view of risk is driven by improvements in seismic risk modeling and not changes in insured exposure.
Ground Motion
Ground motion amplification that occurs during earthquakes is a key consideration. Softer site conditions, such as those made up of silts and clays, tend to amplify shaking compared with stiffer site conditions, such as those made of rock. This amplification has been observed in past earthquakes and contributed, for example, to the heavy damage in the Marina District of San Francisco, following the magnitude 6.9 Loma Prieta Earthquake in 1989.
Although ground motion amplification can occur anywhere there are soil deposits, the magnitude of the amplification is even more pronounced for buildings on sedimentary basins, such as is the case in the Vancouver Basin.
Figure 1: Map of Vancouver Basin. Darker colors indicate deeper deposits of soft soils.The geologic structure and deep deposits of soft soils within a basin amplify shaking several times greater than would otherwise be observed for taller buildings. For example, the sedimentary basin beneath Mexico City, coupled with inadequate design and construction standards, resulted in the collapse of more than 400 buildings following the magnitude 8.0 Michoacán Earthquake in 1985.
The magnitude of ground motion amplification depends on a number of factors, including the magnitude of an earthquake, the distance between the earthquake source and the site, the depth of the basin and the characteristics of a particular building. In general, shaking can be as much as two to four times greater for taller buildings within basins compared with those located on rock.
Modeling techniques that only consider the surface soil conditions generally underestimate the ground motion amplification within basins. But recent research by Sheri Molnar at the University of Victoria and scientists at Natural Resources Canada and elsewhere have provided important data to improve modeling the potential impact of amplification.
Liquefaction
Predicting where liquefaction will occur is another important feature of modeling to identify risk. Liquefaction — a process in which loose and saturated sandy soil transforms into a semi-liquid state during strong earthquake shaking — was a major cause of damage during the 2010-2011 Canterbury earthquake sequence in New Zealand. One of the tremors, the magnitude 6.3 Lyttelton Earthquake in 2011, led to widespread liquefaction in the City of Christchurch, especially along the Avon River, which cuts through the city. The liquefaction caused the ground to vertically settle and, especially closer to the river, move laterally, undermining building foundations.
The destruction and loss of life from these earthquakes was tragic, but the events provided a huge opportunity to learn, acting as a laboratory for the earthquake engineering community. The billions of dollars in claims data, in addition to numerous studies by academics and practitioners, has resulted in a vastly improved understanding of the conditions necessary to cause liquefaction and its impact on the built environment.
One observation from Christchurch is that shallow ground water acts as a sort of fuse for liquefaction, and without it, regardless of other conditions, the process will not occur.
Another observation is that the severity of liquefaction varies significantly over short distances. Maps of liquefaction severity following the Lyttelton Earthquake show dramatic differences in liquefaction over areas just tens of meters apart. This is especially true close to water channels because of the prevalence of loose soil and their “open faces,” which allow the ground to displace laterally.
Figure 2: Liquefaction contribution to modeled insured average annual loss in the City of Vancouver, the Vancouver Basin and surrounding area.The Fraser River Delta in British Columbia has all of these liquefaction triggers present: shallow ground water; loose, sandy soil; and a web of river channels. It also has the most important trigger of them all, nearby faults and the Cascadia Subduction Zone, with the capacity to produce large earthquakes.
Lower Insured Seismic Risk
Looking north of the Fraser River, towards the City of Vancouver, modeled insured seismic risk has reduced. Ironically, this is partly driven by reduced modeled ground motion amplification and liquefaction in the city, but there are other important factors at play. For example, some types of reinforced concrete buildings that are common in the city are now viewed as less vulnerable than they were previously because engineers now better understand their seismic performance.
Looking towards the east, to the provinces of Ontario and Quebec, modeled insured loss (average annual loss and the 500-year return period loss) for these provinces has reduced by more than 40 percent. This change is driven primarily by an improved understanding of seismic hazard within the St. Lawrence River Valley, home to the cities of Montreal and Quebec City, among others.
This leads to another important shift in Canada’s overall modeled insured seismic risk, considering a nationwide perspective. With seismic risk reducing in Ontario and Quebec while remaining relatively stable in British Columbia as a whole, seismic risk is even more heavily concentrated in the west. British Columbia now accounts for almost 65 percent of the country’s insured modeled average annual loss and about 75 percent of the 500-year return period loss.
While changes in risk modeling drive this new view, it is important to acknowledge that earthquake insurance take-up is much lower in Ontario and Quebec than it is in British Columbia. Risk modeling techniques have improved in recent years, thanks to the advances in earthquake science and engineering, as well as lessons learned from past earthquakes. These advances provide insights into a changing insured seismic risk landscape across Canada.
The insurance industry should be aware of these changes and strive to use these emerging insights in their business decisions.…
Senior Product Manager, Model Product Management, RMS
Justin is a senior product manager in the Model Product Management team, focusing on RMS Latin America, Caribbean and Canada earthquake models. He supports the product definition and change management activities for updates to these models. Prior to RMS, Justin managed engineering and research projects focused on community resilience to earthquakes for GeoHazards International, and he has experience conducting site-specific seismic evaluations of existing buildings. Justin is a registered civil engineer in the state of California and holds a bachelor's degree in structural engineering from the University of California, San Diego, a master's degree in structural engineering from the University of California, Berkeley, and a post-graduate diploma from the London School of Journalism. Justin is a member of the Earthquake Engineering Research Institute.