California Wildfires: Special Climate Conditions Drive Enhanced Risk
Kevin Van LeerDecember 07, 2017
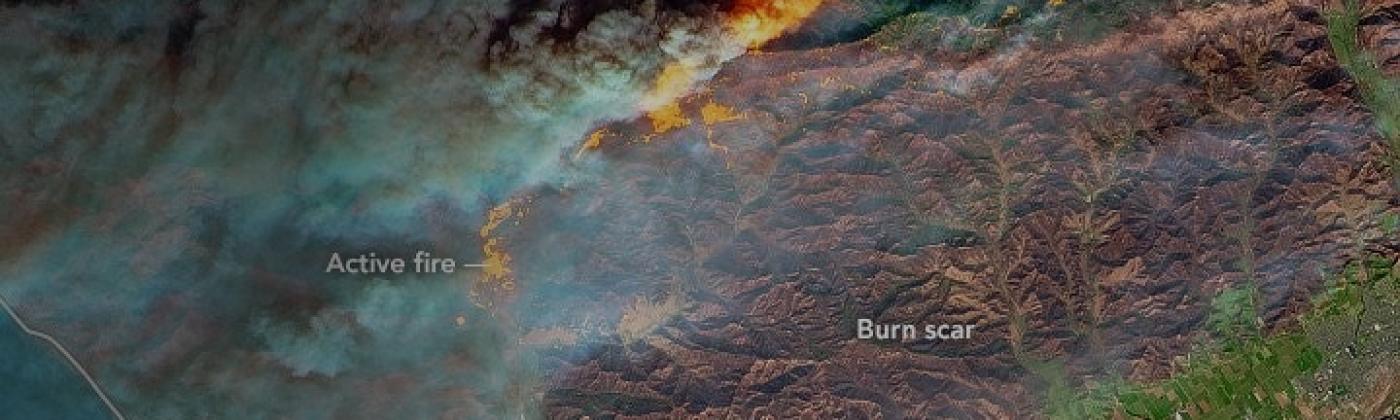
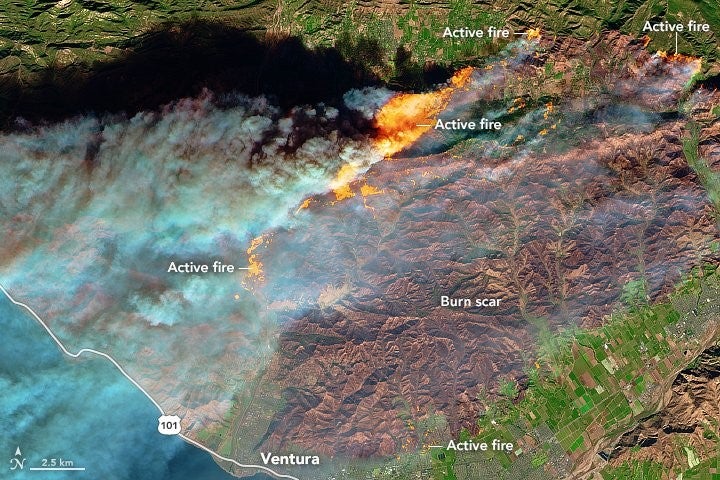
Satellite image taken on December 5, based on observations of visible, shortwave infrared, and near infrared light. Image Credit: NASA
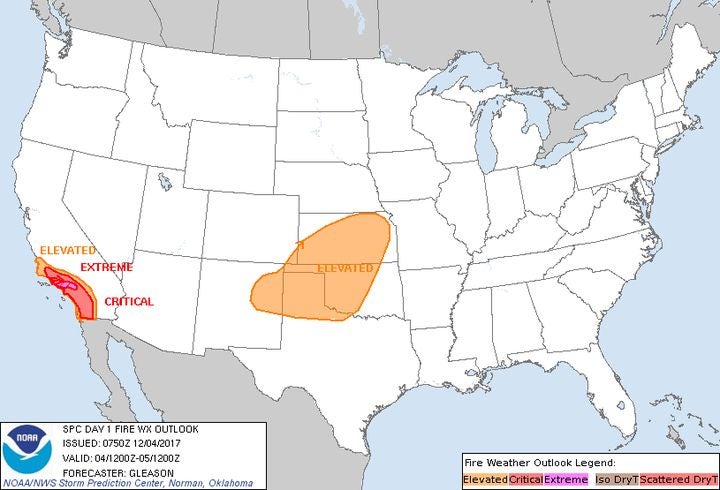
Wildfires are once again raging across California, this time focused in the southern part of the state. Prior to the ignitions, weather forecasts called for a significant Santa Ana wind event from Monday (December 4) through Thursday evening (December 7), driven by a high-pressure system across the western United States. The NOAA Storm Prediction Center noted in their Day 1 Fire Weather Outlookvalid for Monday, December 4, that, “A very strong surface pressure gradient… coupled with strong low-level northeasterly flow will easily support sustained offshore winds of 30-40 miles per hour (48-64 kilometers per hour) across parts of Ventura into Los Angeles counties beginning later this evening and continuing through early Tuesday morning. Wind gusts of 60-80 mph (96-128 km/h) will be possible across the mountains/foothills of these counties where channeling and terrain effects can locally enhance the already strong flow, with gusts of 45-60 mph (72-96 km/h) likely at lower elevations.”
Figure 1: Storm Prediction Center Day 1 Fire Outlook – Monday, December 4, 2017. Source: NOAA Storm Prediction Center
This special climate condition is typical for the region and for this time of year, however the strength, duration, and lack of precipitation associated with this event is particularly significant. The last Santa Ana event to persist over three days was in 2007 and resulted in the Witch Creek fire that destroyed over 1,200 structures across San Diego county.
Special climate conditions like this Santa Ana wind event and the Diablo wind event that contributed to the Wine Country fires in early October, are significant drivers of increased wildfire risk over a short period of time. The combination of these two episodes and additional fires across the country have resulted in one of the worst wildfire seasons in U.S. history with respect to acres burned, structures destroyed, and total insured loss.
When a fire ignites during a high wind event, they typically spread rapidly, stretching firefighting capabilities for suppression and containment until conditions subside. In the case of the Thomas fire that has impacted Ventura, CA over the last few days, the flames spread across roughly 1,000 acres within one hour of ignition on the night of Monday, December 4, and to over 50,000 acres and at least 150 burned structures after 24 hours. The Thomas fire is just one of the many fires across the areas surrounding Los Angeles, including Santa Clarita, Bel Air, and Kagel Canyon, that have threatened or burned structures since Monday evening.
It is interesting to note that in comparison to the roughly 8,000 structures destroyed during the Wine Country fires in October, the reported number of properties affected from the fires so far appears to be in the low hundreds. While the conditions observed for the Tubbs fire were similar, there does not appear to be the comparable level of destruction across suburban areas in the ongoing events. Reasons for the discrepancy could include; more readily defensible homes; greater availability of organized firefighting efforts; a geographic distribution of threatened structures that permitted more effective suppression; early evacuation notices that permitted first responders to fight fires rather than spend time alerting residents of impending fire, and some combination of the above or additional factors. While it is too early to determine the exact cause of the variation in event severity, these differences will be investigated to enable a more informed understanding of the drivers of wildfire risk across regions.
Wine Country Wildfires
Regarding the Wine Country wildfires from October, the California Insurance Commissioner, Dave Jones, has provided an updated insured loss total of US$9.4 billion for that event. The reported insured loss total includes “residential, commercial, automobile and other property claims filed with 260 insurers through December 1, 2017.” The claims cover “…the destruction and damage for more than 21,000 homes, 2,800 businesses, and more than 6,100 private autos, commercial vehicles, and 788 losses involving other lines of insurance such as agricultural equipment and watercraft” according to the statement. Destroyed structures include 5,747 single-family and multifamily homes with 15,359 more damaged. Also, 2,814 commercial properties or multifamily dwellings were damaged, including 997 total losses.
It is important to note that the most recent RMS insured loss estimate of between US$6 billion to US$8 billion released on October 27 excludes loss to additional lines of business beyond residential, commercial, and industrial exposures, such as automobiles, agricultural equipment, and watercraft, along with all damage due to smoke. In addition, loss from properties outside the fire perimeter, such as from damage caused by ember accumulations beyond the burnt area, was not included in the estimate. The published RMS report also noted the uncertainty associated with the event that could result in the observed loss total approaching US$10 billion. RMS will continue to monitor the losses associated with both the ongoing fires and Wine Country fires while working to incorporate insights, such as damage due to ember accumulation and smoke, into the upcoming release of the RMS® U.S Wildfire HD model, part of the RMS North America Wildfire HD Models suite.
Importantly, when developing a probabilistic loss model for the wildfire peril, the characteristics and likelihood of occurrence of the special conditions seen in the events of 2017 must be considered within the creation of an event set. These extreme high wind/low moisture conditions have the capacity to result in tail events that include higher rates of spread and intensity while also taxing suppression resources. The implications of these conditions are critical to understand how to capture realistic wildfire behavior in the fire spread module of catastrophe risk model.
In the forthcoming release of the RMS Wildfire HD model, special climate conditions and their resulting impacts are captured explicitly in the generation of realistic wildfire events and will enable users to understand their likelihood. With this capability, the industry will be better prepared for the types of events that have ravaged the state of California this year and more appropriately price and underwrite individual locations and entire portfolios.
Share:
You May Also Like
January 22, 2018
Southern California: Thomas Fire Loss Estimate and Mudslide Commentary
California Wildfires: Exposure Impacted by the Thomas Fire
As the Thomas Fire continues to climb the list of the top twenty largest California wildfires for both acres burned and structures destroyed, many in the insurance industry are asking how this fire, in addition to the other burned areas across Southern California, will impact their portfolio. A critical element in understanding the industry impact, but also the significance for an individual book, is the insured value of the burned structures. The Thomas Fire, which at 60 percent containment at the time of publication is already the second largest fire in California history with a reported burn area of 272,000 acres (110,074 hectares), has affected several different communities with wide ranges of average insured value.
Figure 1: Top 20 Largest California Wildfires. Source: CAL FIREWhile damage assessments are still ongoing and counts of damaged or destroyed structures are actively being reported, we can use RMS high resolution exposure data and the latest burn footprint available from Geospatial Multi-Agency Coordination (GeoMAC) to gain a perspective on the total amount and average value of exposure across different areas within the perimeter.
Figure 2: Map of the Thomas Fire Perimeter. Source: GeoMAC as of 0100 UTC on December 18, 2017.As of December 18, portions of ten different ZIP codes are located within the Thomas Fire perimeter, spanning across Santa Barbara and Ventura counties. While the fire started north of Santa Paula around sunset on December 4, it has now spread approximately 50 miles (80 kilometers), primarily to the west, to the hills north of Montecito and Santa Barbara. So far, during two weeks of spread the fire has impacted the communities of Santa Paula, Ojai, Ventura, Oak View, Wheeler Springs, Carpinteria, Montecito, and several others. Each of these communities vary in average residential exposure value, making “average” estimates across the entire perimeter more difficult.
Table 1 below compares the residential exposure for the high value 93108 ZIP postal code that spans the Montecito area against the exposure outside of that ZIP code. All values correspond only to exposure located within the Thomas Fire perimeter, according to the RMS high resolution exposure database. The average residential structure exposure value for 93108 is on average three and a half times higher than structures located outside of that ZIP code. Structures in 93108 accounts for only three and a half percent of the number of structures within the fire perimeter, but 12 percent of the total exposure value.
Table 1: Residential Exposure Values in the Thomas Fire Perimeter.As noted in prior blogs about the Wine Country wildfires, it is important to note that only a fraction of the structures within the perimeter will be damaged or destroyed in this event. The reported numbers so far from CAL FIRE are 1,024 structures destroyed and 250 damaged. Comparing this against the total number of structures within the perimeters, the ratio is approximately 37 percent, which is far lower than the 75 to 80 percent seen in the Wine Country wildfires in October this year, but higher than the other historical Southern California events that have been analyzed (Cedar in 2003 and Witch in 2007).
Figure 3: Percentage of damaged or destroyed structures within historical fire footprints.Also, a comparison of the percentage of destroyed structures versus the total number in the perimeter between the Thomas Fire (1,024 destroyed versus 1,274 total or 80 percent) and the Wine Country Tubbs Fire (6,957 destroyed versus 7,443 total or 93 percent), raises important questions for understanding the key differences between the events. This may indicate a stronger presence of fire suppression, lower impacts of embers, more distributed exposure, differences in surface fuel characteristics (e.g. chaparral versus forest) or a combination of these and other factors in the Thomas Fire. A further review of these event-specific factors, including the weather conditions, will provide more clarity around key drivers of these differences.
By extracting information about the differences between these two events, RMS will continue to build insight into the development of the RMS® U.S. Wildfire HD model, part of the RMS North America Wildfire HD Models suite, due for release in 2018. RMS is still monitoring the ongoing events affecting Southern California and will continue to provide updates through RMS Owl.…
As a senior product manager in the Model Product Management group at RMS, Kevin is responsible for RMS climate-peril products for the Americas, including wildfire and custom vulnerability analytics. Kevin has been actively involved in model releases for both severe convective storm and hurricane models over the last four years at RMS. Kevin holds a master’s degree in atmospheric science from the University of Illinois at Urbana-Champaign, where he authored a thesis on tornado-genesis and severe convective storms, and a bachelor’s degree in atmospheric science from Purdue University. He also holds the Certified Catastrophe Risk Analyst (CCRA) designation from RMS. Kevin is a member of the American Meteorological Society (AMS), a mentor for the AMS Board of Private Sector Meteorologists, and a voting member of the ASCE Standards Committee on Wind Speed Estimation in Tornadoes.