Thomas Fire Loss Estimate
RMS has produced estimates for the insured loss arising from the Thomas Fire that affected the Southern California counties of Ventura and Santa Barbara in December 2017. The estimate will fall between US$1 billion and US$2.5 billion, and includes loss caused by burn or smoke damage to personal, commercial, and industrial lines of business, along with insured loss from business interruption and additional living expenses. It excludes loss to automobile and agriculture lines of business and all damage related to the recent mudslides that impacted the same area. This estimate was calculated using RMS high-resolution exposure data and comparisons against historical fire damage, loss, and claim data.
Historically, fires that have damaged approximately 1,000 structures have not exceeded US$1 billion in insured loss. However, RMS notes significant sensitivity of total exposure value to the burn perimeter extent. Adding a 500-meter buffer to the Thomas Fire burn perimeter, as retrieved from Geospatial Multi-Agency Coordination (GeoMAC), increases the total exposure value from around US$2.5 billion to over US$10 billion and to nearly 14,000 structures.

Table 1: Thomas Fire Perimeter Exposure Data
While the burn perimeter was limited in its extension into the wildland-urban interface, the large amount of exposure just outside the fire perimeter may lead to increased claims counts related to smoke damage, business interruption, and additional living expenses, compared to other historical fires. Prior historical events that have damaged or destroyed approximately 1,000 structures, such as the 2015 Butte Fire, 2003 Old Fire, and the 2017 Atlas Fire, have produced approximately two to five times that number in total industry claims. Claims counts of around ten times the number of affected structures are possible from this event, resulting in a higher than average total insured loss.
In addition, the fire directly or indirectly impacted several commercial structures, including the complete destruction of the Vista Del Mar hospital in Ventura, and business interruption to other hospitals, oil field equipment, train services, and schools. This leads to elevated levels of loss beyond the direct damage from flames, resulting in a greater likelihood of reaching the upper bound of the range estimate.
Historical Fire Context
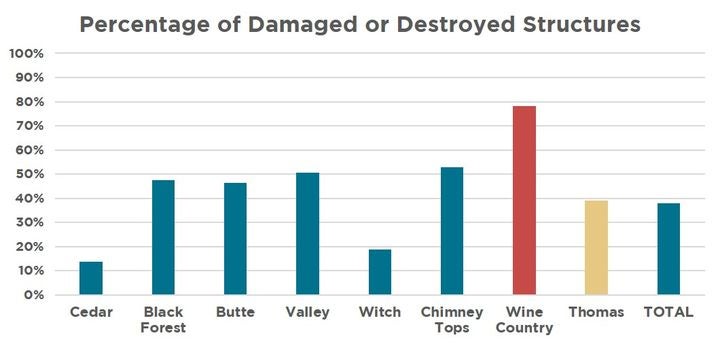
With 1,063 structures destroyed and 280 damaged according to CAL FIRE, compared to 3,450 structures located within the fire perimeter according to RMS high-resolution exposure, the damage percentage within the footprint is approximately 40 percent. In context, that percentage is in-line with other historical fires, outside of the exceptional Wine Country fires in October 2017 as shown in Figure 1.
A key factor not present in the Thomas Fire that differentiates the Wine Country Tubbs Fire, was the occurrence of an urban conflagration that resulted in highly concentrated damage. This did not occur in the Thomas Fire, most likely due to a combination of risk awareness, available fire-fighting capacity, community-level risk mitigation, and weather conditions that were less extreme.

Figure 1: Percentage of damaged or destroyed structures within historical burn perimeters
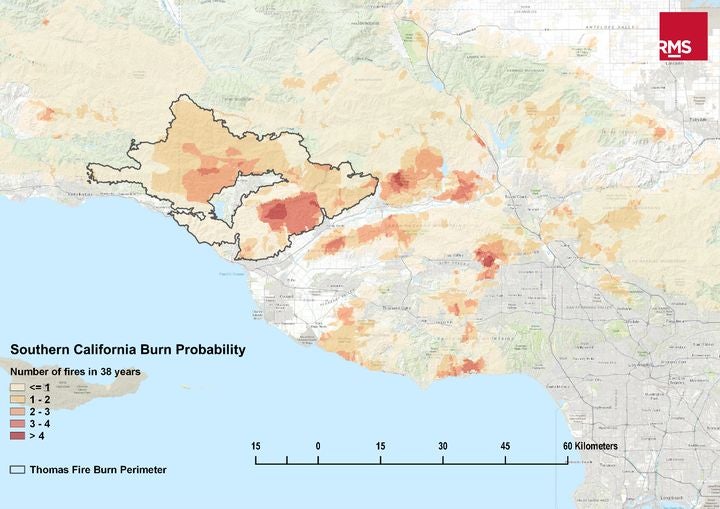
The Thomas Fire burn footprint includes areas that have experienced multiple large fires in the past, such as the 1979 Creek Road Fire, the 2006 Day Fire, and the 2007 Zaca Fire (see Figure 2). In fact, there have been over 200 recorded fires in the area since the late 1800s. Before this event, the largest fire in Ventura County was the 1932 Matilija Fire that covered 220,000 acres (89,030 hectares), representing the fifth largest California event.
However, unlike the Thomas Fire, prior historical fires in the area have not resulted in large numbers of destroyed or damaged structures. At 1,063 destroyed structures, the Thomas Fire ranks seventh on the list of most destructive fires in California, and would have placed fifth on the list if not for the Tubbs (first) and Nuns (fifth) fires from the 2017 Wine Country event. Increases in developed area throughout the footprint and additional burning near the coast has likely contributed to a greater number of structures burned compared to prior historical events.

Figure 2: Historical burn counts since 1980 around the Thomas Fire perimeter
Montecito Mudslides
After four to six inches (10 to 15 centimeters) of rainfall on the Thomas Fire burn scar in early January this year, significant mudslides caused widespread destruction across Montecito and other communities. The damage includes 128 homes and six commercial properties destroyed with an additional 307 homes and 17 commercial properties damaged. Many of these affected structures and families were also part of the evacuation efforts from the Thomas Fire in December.
The combination of a late season, large wildfire event, when the winter rainy season along the West Coast has typically already started, coupled with a severe rain storm directly centered on the burn scar created a perfect scenario for mudslides to occur. While mudslides along the coast of California have been a known issue for a long time, the close temporal proximity of the fire and the rain made this a particularly notable event.
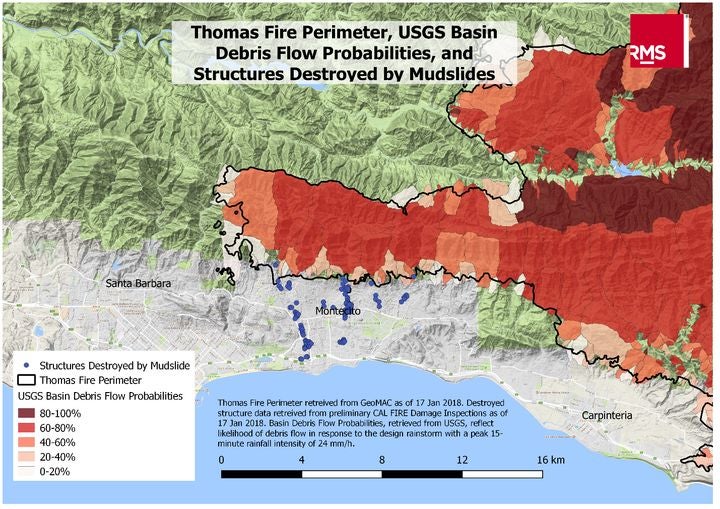
The U.S Geological Survey (USGS) created an estimate of basin debris flow probabilities before the mudslides occurred, which are based on the forecasted rainfall from the event. The figure below overlays these probabilities with the Thomas Fire perimeter and the destroyed structures in the Montecito area. It highlights the spatial correlation between the higher debris flow probabilities and the impacted areas downslope from the burn scar.

Figure 3: Thomas Fire perimeter, USGS debris flow probabilities, and structures destroyed by mudslides (Perimeter source: GeoMAC; Structure Data source: CAL FIRE Preliminary Damage Surveys)
The question now for affected residents and business owners becomes one of insurance. To be covered under a standard homeowner’s policy, the damage from these mudslides must be attributed directly to the Thomas Fire. Without attribution to the Thomas Fire burn scar, the damage would typically be excluded and is left to a separate flood policy, if present.
Given the low penetration rates of flood coverage nationally, as seen even in the flood prone area of Houston with Hurricane Harvey (see RMS press release), it is unlikely that flood policies are prevalent throughout the affected area. This leaves home and business owners in the difficult position of making the case that the mudslides were a direct result of the wildfire. It remains to be seen what the outcome of this event will be in terms of insurance payout, but it will be closely monitored to understand the future of how these two perils — flood and wildfire — interact and result in highly correlated catastrophic losses.


