Michael Drayton and Ashley Bernero
Michael Drayton is a Consultant for RMS, based in New Zealand.
Ashley Bernero is a Product Manager within the Earthquake Model Product Management team at RMS.
Log In
Access all customer product support, event response, and training in one place
LifeRisks PortalFind modeling tools based on best practice actuarial techniques and medical science
Miu PortalExplore analytics and risk insights for the alternative capital market
Insurance Solutions
Formerly Moody’s RMS
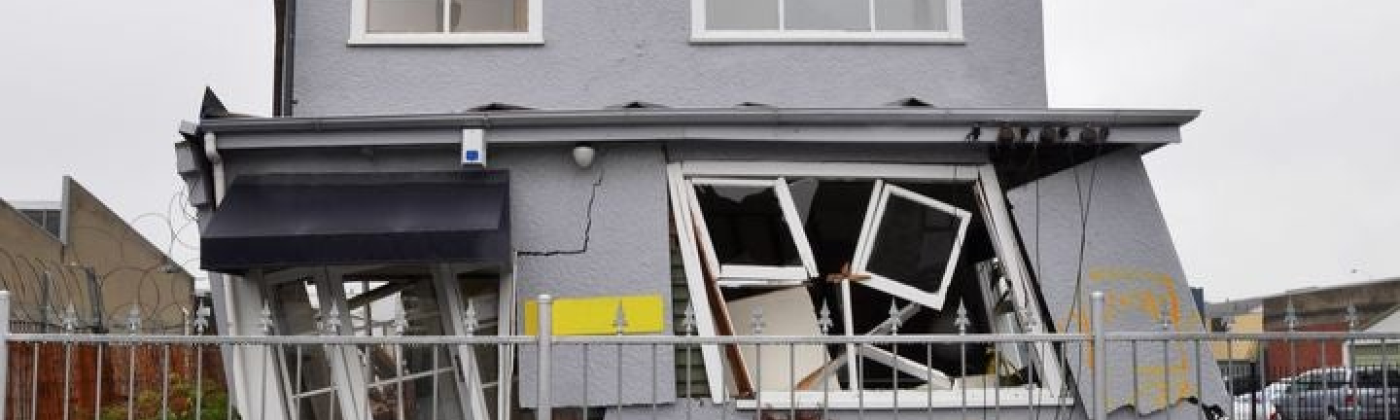

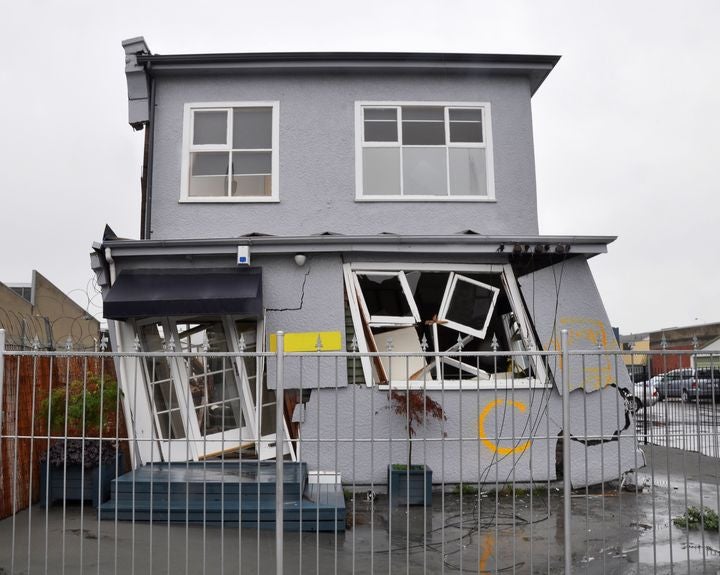
Around 98 percent of residential homes in New Zealand have earthquake insurance. This remarkable achievement is due to a unique partnership between the New Zealand government Earthquake Commission (EQC) working together with the insurance industry. From its origins in 1945 as the Earthquake and War Damage Commission – renamed as the EQC in 1993, the Commission is supported by an Act of Parliament which sees the Crown as the insurer of first resort for earthquakes in New Zealand. The EQC provides the first layer of coverage for 1.84 million residential properties across the country, with the private market delivering cover over this initial layer.
The EQC administers the New Zealand Natural Disaster Fund (NDF) which receives monies directly passed on by private insurers, from a flat rate levy imposed on all households who purchase a homeowner insurance policy. The EQC is also responsible for investing the fund and ensuring there is adequate reinsurance cover available.
The NDF has supported the country’s homeowners through a series of damaging events since the start of this decade, providing NZ$100,000 (US$67,332) of buildings and NZ$20,000 (US$13,466) of contents cover for each event. Before the Canterbury earthquakes in 2011-12, the NDF had NZ$6.4 billion (US$4.27 billion). By 2018, including payments for the Kaikoura earthquake in 2016, the NDF had just NZ$287 million (US$195 million) left and was perilously close to the NZ$200 million limit where the government is mandated to top up the fund.
The government has taken many measures to address the situation. The levy first increased in February 2012, rising from five cents per NZ$100 of cover, to 15 cents per NZ$100 of cover, up to a maximum annual payment of NS$207.
After Kaikoura, the then finance minister Steven Joyce said in 2017 “The EQC has a Government guarantee and NZ$4.7 billion in reinsurance cover, so homeowners will be covered if there is another natural disaster, but we need to start the process of replenishing the fund, so it is available to contribute to future natural disasters.” Another round of levy increases in November 2017 saw the flat rate rise to twenty cents per NZ$100 of cover, to a maximum annual payment of NZ$276. These levy changes will increase annual contributions to the fund from NZ$26 million in 2017-18, to NZ$94 million in 2018-19.
Moving beyond levy increases, a new Earthquake Commission Amendment Bill is also working its way through Parliament and at the time of writing is now at its Third Reading, the final stage before Royal Assent and being passed as a law. The main changes proposed by this Bill are focused around the coverage layers provided by the EQC. This would see buildings cover extended to NZ$150,000 and the complete removal of contents cover from the EQC. These changes could come into force as soon as July 1, 2019.
How Will the EQC Changes Impact the Insurance Industry?
The current EQC layers represent a sizeable deductible and this increase from NZ$100,000 to NZ$150,000 for buildings, and a decrease from NZ$20,000 to zero for contents will lead to major changes in the private market’s gross losses above these EQC layers. Although the introduction of these changes has still to be set, if it was introduced on July 1, 2019, these changes will take one year to be implemented as individual insurance policies come up for renewal. For reinsurance, the impact will be felt over a two-year period, affecting January 1, 2019 renewals before all homeowner policies and reinsurance contracts cover only the new EQC coverage limits. The insurance industry is predominantly trans-Tasman, covering both Australia and New Zealand, so the industry needs to know how these changes affect solvency across the countries.
To help the market understand the likely effects of the changes to the EQC, RMS has updated its New Zealand Industry Exposure Database (IED), with both the updated New Zealand IED and Earthquake Industry Loss Curves (ILCs) available from RMS. We have trended exposures to represent 2018 values and then applied the proposed EQC financial structures. Here we discuss loss changes only from the EQC reconfiguration. Although the New Zealand residential market is very consolidated and while these industry loss changes will be informative, individual portfolios may experience different percentage changes due to variations in geographic distribution of exposure.
Changing the EQC layers does not change the overall ground-up average annual loss, only the way the loss is allocated to the EQC and the private market. For the EQC, increasing its buildings cover to NZ$150,000 increases its gross average annual loss (AAL) by 12 percent for single family dwellings (SFD), and eight percent for multi-family dwellings (MFD), adding some NZ$21 million in potential losses. For the private market, the removal of NZ$21 million in AAL leads to gross AAL decreases of 39 percent for SFD, and 53 percent for MFD.
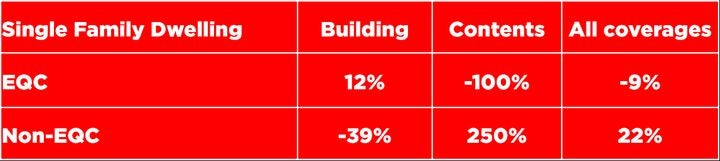
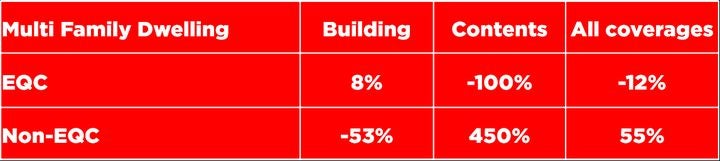
But then, the impact of the EQC decision to eliminate its contents coverage needs to be considered. Removing this NZ$20,000 coverage slices off NZ$42 million in AAL from the EQC. Adding this NZ$42 million to the private market, the contents gross AAL increases by 250 percent for SFD, and 450 percent for MFD.
Purely in terms of technical premium, the proposed changes to the EQC will result in the private market taking on slightly more risk as the added AAL from contents outweighs the reduction in AAL from buildings. On the other hand, the market is looking forward to more efficient claims handling under the government’s proposals.
Any changes in technical premium will no doubt be a sensitive issue for private insurers if costs need to be passed on to their policyholders, and any increases will come under further intense media scrutiny. The country is still adjusting to the introduction of risk-based pricing for earthquake by some insurers and this has been controversial.
The EQC changes will also affect the exceedance probability (EP) curve and the 1,000-year losses – of particular interest to insurers, reinsurers, and the Reserve Bank of New Zealand (RBNZ) – the NZ regulator. The 1,000-year loss acts as the reference return period for RBNZ’s solvency standards. Running the RMS 2018 IED through the RMS New Zealand Earthquake HD model we can see that, as expected, the 1,000-year loss for the private market does decrease, with EQC picking up more of the loss in the tail.
Traditionally, Australia Earthquake has been regarded as the clear driver of trans-Tasman solvency. In 2016, RMS launched the New Zealand Earthquake HD model, which incorporates the lessons learned from the Canterbury EQ Sequence. And in 2018, RMS updated both the Australia Cyclone and Australia Earthquake models. Each of these three models is important for private insurers operating in both Australia and New Zealand to determine their whole-of-portfolio, all-perils solvency requirements.
In a race that nobody wants to win, the updated models show New Zealand Earthquake edging ahead of Australia Earthquake, at an industry level. But now with the redistribution of New Zealand Earthquake liability between the EQC and the private market, it remains to be seen whether the activity later in 2019 may change the balance again.
Michael Drayton is a Consultant for RMS, based in New Zealand.
Ashley Bernero is a Product Manager within the Earthquake Model Product Management team at RMS.

