The Mw7.1 – 2019 Ridgecrest (California) Earthquake Sequence
Marleen NystJuly 29, 2019
The recent events that shook a relatively remote part of the Mojave Desert region of Eastern California provide an acute reminder of the major risk posed by earthquakes in the state. It has been a while now since California experienced a large earthquake, and the main event in this sequence – with a magnitude of Mw7.1, was the most powerful earthquake to occur in the state in twenty years.
Since then, the field of seismology as well as earth scientific measuring capabilities have undergone quite substantial improvements and innovations. Immediately after the start of the sequence, several coordinated efforts from academic, government and engineering organizations resulted in focused field surveys and the installation of additional, more densely spaced instrumentation to monitor seismicity and surface deformation, in and around the epicentral area.
So far, extraordinary amounts of high-quality data have been collected that will undoubtedly provide new insights and understanding of earthquakes in general and earthquake hazard and risk in (Southern) California, in particular. Work on these new data sets has only just started, but what have we learned so far? Here is a summary of observations and interpretations based on various (preliminary) field surveys, reports and briefings.
Description of Events
The earthquake sequence is referred to by the United States Geological Survey (USGS) as the Mw7.1 Ridgecrest Sequence, because it occurred east of the town of Ridgecrest (pop. ~28,000), which is south of Owens Valley, and southwest of Searles Valley, in San Bernardino County.
The first damaging event in the sequence on July 4, 2019 had a magnitude of Mw6.4. It was preceded by several foreshocks, most notably a Mw5.0 approximately thirty minutes earlier. The Mw6.4 ruptured toward the southwest and turned out to be a foreshock of the main event in the sequence – the July 5 Mw 7.1 magnitude earthquake. This main event initiated just northwest of the Mw6.4 foreshock and then ruptured bilaterally in northwest and southeast directions. At this point, the maximum reported horizontal slip is 4.5 meters, the maximum reported vertical separation is 3.7 meters.
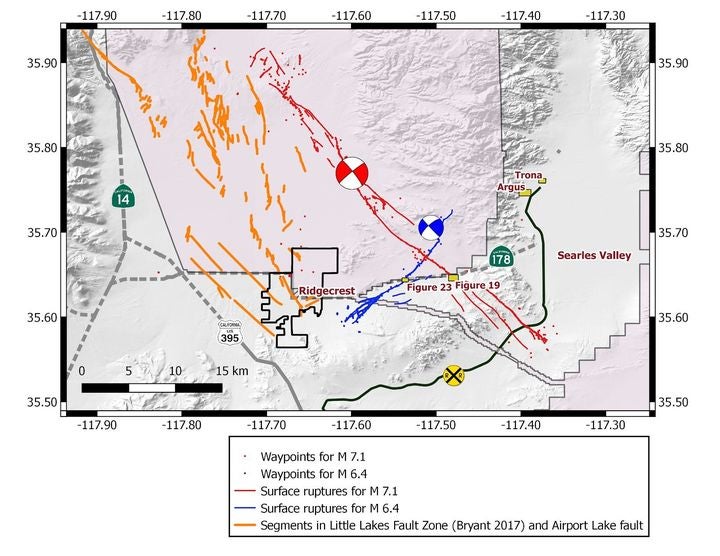
Figure 1: (From report GEER-064, 2019). Map with main roads and exposure areas. The blue “beach ball” represents the strike-slip focal mechanism of the July 4, Mw6.4 event and is located at its epicenter. The blue lines represent the observed surface rupture of the first damaging event. The red strike-slip focal mechanism is located at the epicenter of the Mw7.1 (main) event in the sequence. The red lines represent its observed surface ruptures. The pink shaded area outlines the Naval Air Weapons Station, China Lake.
Damage
The earthquakes were felt strongly in the China Lake-Ridgecrest area, and more broadly from Los Angeles to Las Vegas. At least 3,000 Ridgecrest residents lost power due to the Mw7.1 event. Transportation systems, bridges and roads sustained none to minor damage. Except for the typically vulnerable buildings like unreinforced masonry mobile homes and a few house fires, Ridgecrest sustained little structural damage. Non-structural and contents damage was more substantial. Considering that the Mw 7.1 mainshock radiated more than 3.5 times more energy than the 1994 Mw 6.7 Northridge event, had the earthquakes happened during the week or in a more urban area, fatalities and injuries could have been much larger.
The town of Trona (pop. ~1,800), some fifteen miles (24 kilometers) northeast of Ridgecrest, lost its access to water for over a week, because the Mw7.1 event ruptured the main water pipes. Since Trona is built on the edge of a dry lake bed (Searles Lake), the soft sediments caused strong site responses and liquefaction, which explains why Trona sustained more damage than Ridgecrest overall, resulting in over two dozen homes in the small community being red-tagged as too dangerous to enter due to the damage.
Tectonics, Aftershocks and Focal Mechanisms
Tectonic motion between the Pacific and North America plates is accommodated across a variety of crustal faults and fault zones, called the Pacific-North America plate boundary. The San Andreas Fault (SAF) is the best-know member of this plate boundary system. The Ridgecrest Sequence occurred in the Eastern California Shear Zone (ECSZ), another important component of the plate boundary, located 87 miles (140 kilometers) east of the SAF, accommodating about 20 percent of the total relative plate motion. This region extends from the southern Mojave Desert, along the east side of the Sierra Nevada, and into western Nevada.
The Mw6.4 and Mw7.1 epicenters are located close to each other. Both events ruptured previously unknown faults. The orange lines in Figure 1 (above) show the fault map as understood before the sequence: in this part of the ECSZ, deformation was thought to occur in a distributed manner across a lot of small fault segments.
The Ridgecrest Sequence occurred in an area immediately south of the southernmost extent of the 1872 Owens Valley earthquake. This event had a roughly north-south trend and is considered one of the largest earthquakes in recent California history with an estimated magnitude between 7.6 and 8.0.
Between these two large events lies the Coso Volcanic Field, which houses a geothermal plant. Before the Ridgecrest event, some speculated that the volcanic activity is warming up and thereby weakening the crust and making it incapable of building and releasing stress in the way cold crust does, and therefore not able to produce larger earthquakes. We now know that this area can produce large earthquakes, but it is interesting to see that the Ridgecrest Sequence stopped short of the Coso Volcanic Field.
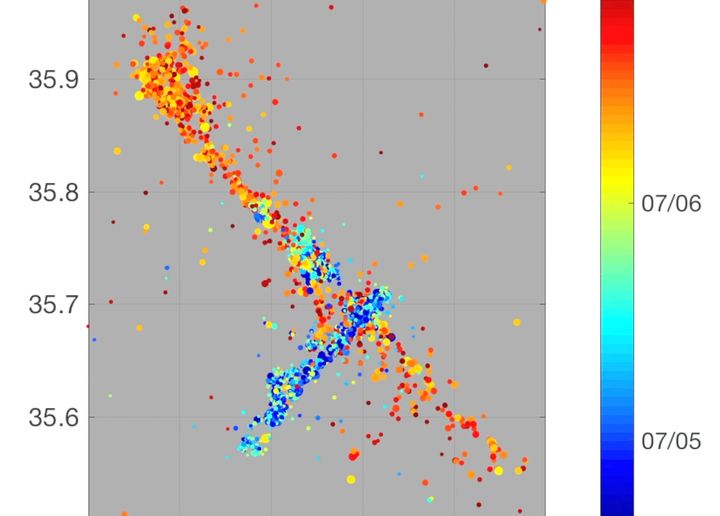
Figure 2: The USGS created a three-dimensional image of all the aftershocks that occurred through July 6. Following this link will take you to the 3D demo. The figure shows the two-dimensional representation, where the aftershocks are mapped to the Earth’s surface. The color coding denotes time, the events earlier in the sequence (and associated with the Mw6.4 event) have cooler colors, the events later in the sequence (and associated with the Mw7.1 event) have warmer colors.
So far, the earthquakes have produced a relatively energetic aftershock sequence with close to 100,000 measurable aftershocks (Figure 2). From the aftershock sequences for both events, we can clearly see that the first event ruptured two different fault planes. Surface rupture due to Mw6.4 event reveals a northeast-southwest fault zone, but the second part of its aftershock sequence shows northwestward migration onto the fault plane of the main event (cyan blue dots in Figure 2). This is the approximate location of the Mw7.1 epicenter. The extent of the aftershock sequence of the Mw7.1 event reaches as far south as the large, east-west trending Garlock fault zone (and doesn’t seem to cross it). The Mw6.4 fault and slip orientation are similar to the Garlock fault, whereas the Mw7.1 fault and slip orientation are similar to the SAF and the Owens Valley earthquake.
Interaction between the two events can be described as the northern wall of the Mw6.4 event moving westward and releasing normal stress off the fault surface of the Mw7.1 earthquake, thereby “unclamping” the fault walls of the Mw7.1 event and allowing the second fault to rupture in a right-lateral motion. These interactions have been hypothesized and modeled, but never so well observed and measured.
Future
The Ridgecrest events will continue to provide important information on all aspects of earthquake risk. Newly gained insights into the interaction between the events in the Sequence will allow us to expand existing event sets. To the first order, the ground motion recordings show a good agreement with prevailing ground motion prediction equations (GMPEs), so we will be able to use the large amount of new data to refine the existing ground motion models.
Detailed site response data will provide input for improvements to our soil amplification and liquefaction models. Damage levels observed in the field seem to agree to the first order with damage ratios modeled with RMS RiskLink. We are still awaiting more detailed information on actual claims data. Claims data, especially contents related, will trickle in and allow us to develop a good understanding of the total loss with time and allow for improvements to the building response module.
We hope to report here on a regular basis about earthquake risk lessons learned from the Ridgecrest Sequence.
Sources:
Report from Geotechnical Extreme Events Reconnaissance (GEER)
Marleen leads the earthquake source modeling team for RMS earthquake models. For the RMS North America Earthquake Models release, Marleen oversaw the hazard component development and its validation.
Prior to RMS, Marleen worked as an Earth Sciences postdoctoral scholar for the USGS and at Stanford University. Marleen holds a master's in Geophysics from the University of Utrecht and a PhD from the Delft University of Technology, The Netherlands.