Australia: Comparing Earthquake Rates for New South Wales
Marleen NystNovember 04, 2021
The Mw5.9 earthquake that hit close to Melbourne, Australia, on September 22 is the largest onshore earthquake in the state of Victoria in recorded history. It reminds us that if RMS® only used the earthquake catalog to model seismic hazard in Australia, the frequency of these larger events would probably not be very accurate and likely be too low. So, how do we account for these larger-magnitude earthquakes in the RMS® Australia Earthquake Model?
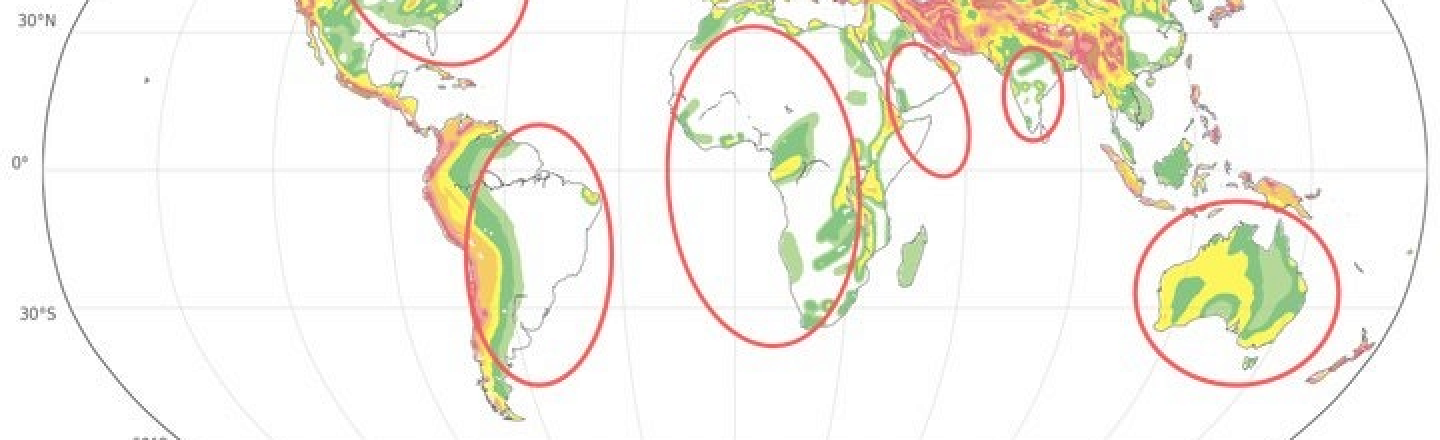
Australia is largely a stable tectonic region, comparable to Canada and Siberia. Yet, global seismic hazard maps, such as the Global Seismic Hazard Assessment Program (GSHAP) 1999 map (Giardini et al., 1999), had underlined how seismic hazard levels were assessed as being higher in Australia than in other similar regions.
The introduction of the 2018 National Seismic Hazard Assessment (NSHA2018) from GeoScience Australia (GA) represented a major update to the 2012 Australia National Seismic Hazard Maps. As my colleague Jochen Woessner commented in his blog after the launch of the NSHA2018, there were revisions to both the earthquake catalog data and the ground motion model, among other changes, which saw lower ground-shaking estimates than in the previous 2012 version.
Understanding Seismic Risk in High-Exposure Areas
The NSHA2018 aligned the hazard in Australia with the rest of the world. But although the seismic risk is within a stable continental region, and earthquake frequency for Australia is relatively low, the risk remains and needs to be understood, especially for areas of high exposure.
The RMS Australia Earthquake Model reflects the latest scientific view of seismic hazard by incorporating earthquake data underlying the NSHA2018. Updated event rates and ground motion models, combined with insight from local experts and published research, provide the most up-to-date view of seismic risk in the country.
The NSHA2018 primarily relies on the GA earthquake catalog, which is relatively short compared to Japan or Europe, for instance. To cover the full seismic cycle, other data sources are needed and are therefore included in the RMS model.
One major difference between our model and the GA model is that we include slowly moving active faults. RMS considers the geological records of thousands to tens of thousands of years of fault activity in the region, capturing potential active faults that have not had earthquake activity in the period covered by the GA earthquake catalog.
This means that rates from the RMS RiskLink® Version 18 Australia Earthquake Model could differ from results obtained from the NSHA2018. Our clients naturally wanted to know about the approach we took and why we think it reflects the risk more fully. One client asked why the frequency of events, or earthquake rate, in New South Wales in the RiskLink Version 18 model is higher than in the NSHA2018.
Examining New South Wales
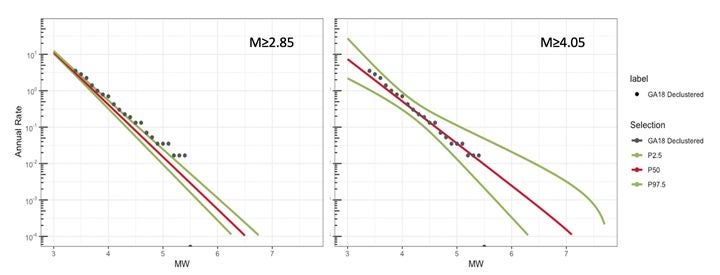
New South Wales is Australia’s most populous state, with around 5.3 million residents living in the Sydney metropolitan area. The graphs in Figure 1 show the earthquake rate difference in New South Wales, with the dots representing the NSHA2018 rates. This rate difference is due to different assumptions about earthquake catalog completeness in combination with our decision to also include insights gained from regional geological studies.
Figure 1: Magnitude-frequency plots for New South Wales in Australia’s earthquake catalog by GeoScience Australia (GA) and RMS. In both figures, the grey dots indicate the annual rates (or frequencies) of the 2018 “declustered” GeoScience Australia earthquake catalog. Red lines indicate the Gutenberg-Richter fit of the GA2018 data. Green lines indicate the uncertainty bounds for the GA completeness model (left) and for the RMS completeness model (right). Source: RMS
To take a closer look at these model differences, let’s start with the earthquake catalog analysis. Generally, three main processing steps lead to a catalog-based rate model. First, the catalog is “declustered” to remove dependent events (fore- and aftershocks, swarm events) and to leave independent events (mainshocks).
The next step is to determine the completeness of the earthquake catalog or, in other words, to quantify how well the catalog represents the seismic cycle in the region it covers. Consideration of catalog completeness plays an important role in the RMS hazard model for Australia. We say that the catalog is complete if it contains all the earthquakes of the full seismic cycle.
For Australia, tectonic deformation is slow, and so the full seismic cycle is long (probably on the order of tens or hundreds of thousands of years). This means that the earthquake catalog is only partially complete up to a certain magnitude and does not contain all the earthquakes that will happen during the full seismic cycle [1]. Therefore, we need to make assumptions about the frequency of larger-magnitude events in Australia because we cannot calculate that frequency straight from the recent GA catalog.
The largest event in the GA earthquake catalog has a magnitude of Mw5.5. The NSHA18 assumes that the earthquake catalog in New South Wales is complete since 1966 for the magnitude range 2.85 ≤ Mw ≤ 5.5. RMS deviates from this completeness view by arguing that the catalog probably doesn’t contain all the very small (2 < Mw < 4) earthquakes that happened in this region since 1966. The region is vast, not populated everywhere, and has not always been densely monitored, so smaller earthquakes must have occurred without being recorded. RMS takes a more careful stance and assumes that the catalog is complete for the considerably narrower magnitude range of 4.05 ≤ Mw ≤ 5.5.
The final stage in the catalog analysis is to fit the data with a magnitude-frequency model that provides rates for the full magnitude range of all possible earthquakes in the region. In seismology, Gutenberg-Richter (GR) is a common model to express that relationship. It extrapolates the statistical behavior of the smaller-magnitude events in the catalog to larger-magnitude ranges. Both RMS and GA assume that the maximum magnitude earthquake that can occur in New South Wales is Mw7.0.
Figure 1 above depicts the implication of different completeness assumptions for the final rate model in New South Wales. The graph on the left shows how GeoScience Australia fits a GR model to the 2.85 ≤ Mw ≤ 5.5 data range and then uses this to forecast the rate of Mw ≥ 5.5 or larger-magnitude events. The graph on the right shows how assuming that the record is complete for Mw ≥ 4.05 delivers a different view and higher rates for the magnitude range that matters for risk models (indicated by the red line in the left graph versus the red line in the right graph).
The uncertainty bounds are narrower when using the longer-magnitude range completeness because there are more-smaller-magnitude earthquakes in the event set (indicated by the green lines in the left graph). Basing the GR fit on a narrower magnitude range significantly reduces the size of the underlying dataset and therefore increases the uncertainty of the rates for the larger-magnitude events (indicated by the green lines in the right graph). This means that the RMS Australia Earthquake Model rates for New South Wales fall well within the uncertainty bounds on the rates coming from the earthquake catalog analysis.
This leads to the next question, why the RMS frequency for earthquakes with magnitude larger than Mw5 is higher than the mean rates calculated from the earthquake catalog (the red line in the right graph), while staying within the uncertainty bounds (green lines in the right graph). As mentioned before, to model earthquake activity for a stable continental region such as Australia, more data sources need to be considered. Earthquake catalogs only give a short temporal snapshot of seismic activity. Therefore, the RiskLink Version 18 model also considers fault activity.
Using Additional Data Sources
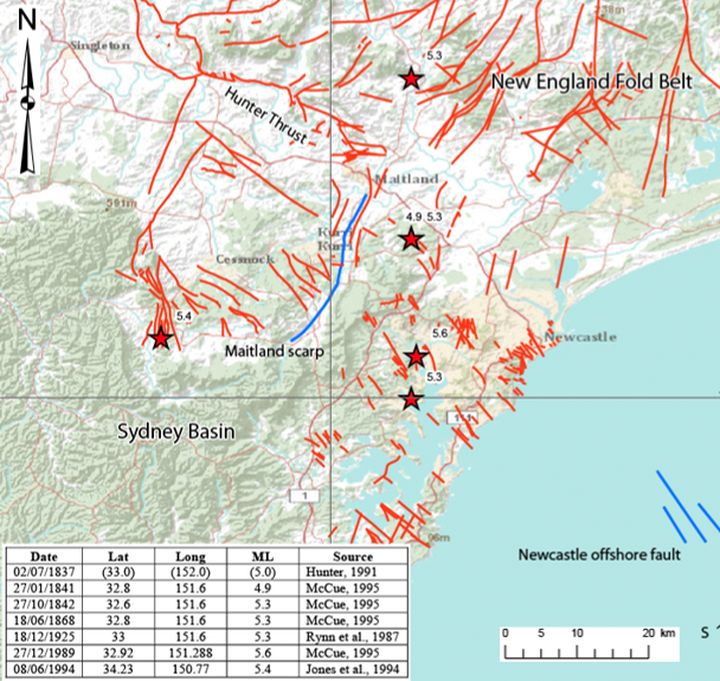
Clark (2010)[2] argues that risk models should be informed using knowledge of local neotectonics. There is a good prehistoric earthquake record representing New South Wales. Faults west of Sydney belonging to the Lapstone Structural Complex and faults beneath the greater Sydney region are associated with infrequent damaging earthquakes (Figure 2).
Figure 2: Historic earthquakes in the Newcastle region (error bars may be up to 50 km) are red stars; fault scarps (from the GA neotectonics database) are blue lines; and mapped basement geology are red lines. (Source: Clark, 2010)
An earthquake with a Mw >= 5 happens every 15 to 30 years in an area roughly a third of the size of New South Wales. If we assume a similar type of seismicity for the whole region of New South Wales, because the tectonics are the same throughout the region, then this means that a Mw > 5 occurs every five to 10 years. The RMS model rate estimates for larger-magnitude events in New South Wales are in line with these longer-term geological observations: An earthquake with Mw >= 5 occurs every five years for the entire region and every 10 years for Sydney.
This overview shows that the RiskLink Version 18 Australia Earthquake Model rates are reasonable given the uncertainties of the data and the various assumptions that need to be made to model earthquake activity for a stable continental region. The RiskLink Version 18 Australia earthquake rate model is a good representation of earthquake activity for the region, appropriate for earthquake risk assessment.
The NSHA2018 is a landmark model, and its findings are incorporated within the RMS model. But it pays to understand the way the NSHA2018 was built, the event catalog used, and how the lack of significant historical events can tend to underestimate rates in high-exposure areas such as Sydney.
[1] The seismic cycle of a fault refers to the process of stress buildup on the fault over time and the subsequent rapid stress release in an earthquake. To represent all the possible earthquakes in a region, an earthquake catalog would have to be hundreds of thousands of years long. In regions of slow tectonic deformation, as in Australia, the seismic cycle is relatively long compared to regions of fast tectonic deformation, as in California, where the seismic cycle is relatively short.
Marleen leads the earthquake source modeling team for RMS earthquake models. For the RMS North America Earthquake Models release, Marleen oversaw the hazard component development and its validation.
Prior to RMS, Marleen worked as an Earth Sciences postdoctoral scholar for the USGS and at Stanford University. Marleen holds a master's in Geophysics from the University of Utrecht and a PhD from the Delft University of Technology, The Netherlands.