In the midst of the 2020 Atlantic hurricane season, with storms forming in rapid sequence, records broken early in the season and four storms already producing significant damage in the Caribbean and U.S., whether we are headed for a record-breaking year is a good question. Various forecast agencies have issued mid-season updates, which signal prospects for the remainder of the season. But what about the 2020 season to date, and how does it compare to notably active seasons of the past?
In this blog, we’ll compare and contrast 2005, perhaps the most memorable Atlantic season in recorded history, to 2020 so far. Ultimately such a comparison resonates with the insurance industry, comparing not just the number of hurricanes, but the wind damage they are capable of producing, and how much of that damage is realized. What was unfolding at this time exactly fifteen years ago, and how does 2020 compare?
A Storm Is Born
Comparing the number of tropical cyclones formed by mid-September in 2005, the figure below shows that 2020 has already proven to be “hyper-active.” Arthur and Bertha formed before the official Atlantic hurricane season kicked off on June 1, 2020 and by September 15, 2020, roughly the season’s midpoint, 21 tropical cyclones have developed, 20 of them named, nearly double the average for an entire season of about eleven. Every named storm this year has been born—what meteorologists refer to as its “genesis”—prior to its 2005 counterpart. The latest, Tropical Storm Vicky, maintained this year’s aggressive pace of cyclo-genesis, a “V” storm forming nearly three weeks prior to the “V” storm from 2005, namely Hurricane Vince which formed that year on October 5.
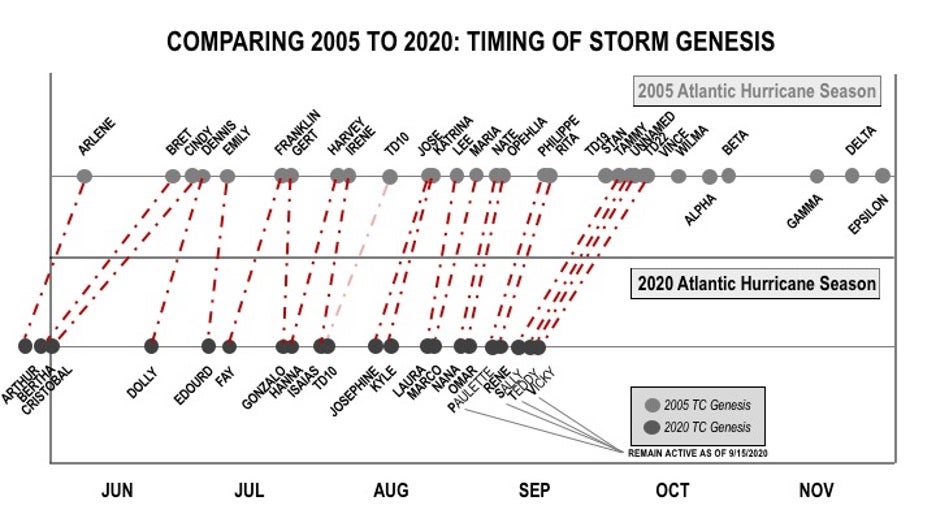
Yet the 2005 “season that wouldn’t end” was the first in which the Greek alphabet was used to name storms, with tropical storms, some even reaching hurricane strength, well into the month of December. The official season ends in November. So, will 2020 gain such notoriety?
Consider Intensity
Based solely on how many storms have formed so far this season, one might expect the 2005 record of 28 named storms in a single season to be broken this year. The second half of the season has yet to play out, but if conditions persist, this year will be a memorable one. However, the number of storms that form in a given year are only relevant to the insurance industry if they develop damaging winds and make an impact on insured exposure.
Last year, Hurricane Dorian reached Category 5 strength (the strongest on the Saffir-Simpson scale) and produced devastating damage in the Western Caribbean, the strongest storm on record to affect the Bahamas. Dorian will be remembered not because it formed in a hyper-active season, but because of its intensity and damage impacts in the form of strong winds and flooding. The same can be said of Hurricane Andrew, which in 1992 was followed by just six more storms that year. Yet, that season will be remembered for the impacts of that one devastating event, not the below-average activity that season.
If we now overlay storm intensity onto the same chart (below), again for 2005 and 2020, how do they compare?
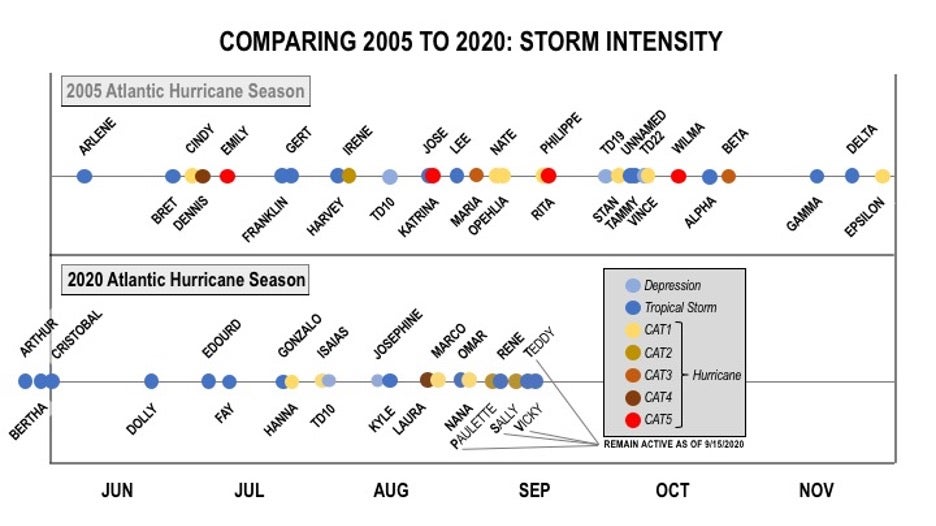
The chart shows that only seven of the 21 tropical cyclones this season (Hanna, Isaias, Laura, Marco, Nana, Paulette, and Sally) reached hurricane strength, four only achieved short-lived CAT1 status—with Laura making landfall as a CAT4 hurricane and at time of this blog’s publication—and Hurricane Sally poised to make landfall along the Gulf Coast. CAT1 hurricanes can produce damage and destruction, but pale in comparison to the disaster potential of a major hurricane (CAT3 and above). As a case and point, Hurricane Laura has produced widespread loss owing to both wind and flooding along the Gulf Coast. Click on the link for more information on RMS North Atlantic Hurricane Models.
By this point in the 2005 season, nine cyclones had reached hurricane strength, four were major hurricanes, as Dennis reached CAT4 status and Emily reached rare CAT5 status with winds exceeding 160 miles per hour! Hurricane Dennis set the record for the strongest hurricane to form before August, a record broken just a week later by Emily.
At this point in mid-September, nobody could have predicted what was in store for the remainder of 2005 culminating in a record number of named storms, number of storms prior to August, number of hurricanes, major hurricanes, CAT5 hurricanes, and number of days with an active storm in the basin. That remarkable season also saw the first recorded tropical cyclone to make landfall on the Iberian Peninsula (Vince); the first to impact the Canary Islands (Delta), and Hurricane Katrina, the most devastating hurricane landfall on record, which itself broke a number of additional records that year.
Katrina actually made landfall twice in the U.S., first at CAT1 strength not far from Miami, then the New Orleans landfall of which many have vivid memories. The 2005 season is etched in the memory of all of us in the industry at the time, as nonstop and exhausting.
What Matters Most: Wind Damage Potential
So, while storm frequency matters, storm intensity matters more. Consider this—if you take a storm and duplicate it or double its frequency—you will double the damage potential. But, if you take a storm and double its wind intensity—from say 60 to 120 miles per hour—you will increase the damage exponentially, maybe 5x or even 10x. In 2005, we saw a devastating combination of frequency and intensity, and several of the strongest hurricanes made landfall including Katrina, Rita, and Wilma. When we measure up 2020 against 2005 at the end of this year, we’ll need to consider both the number of storms and their intensities.
The Accumulated Cyclone Energy (ACE) index provides an integrated metric that combines frequency and intensity as a proxy for the total wind energy generated by storms over the course of an entire season. ACE approximates the wind energy of each tropical system for every six hours of its life cycle. Seasonal ACE is the sum of ACE for each of the individual storms occurring in that season. So, ACE takes into account the number, intensity, and duration of storms—a more useful metric for risk managers.
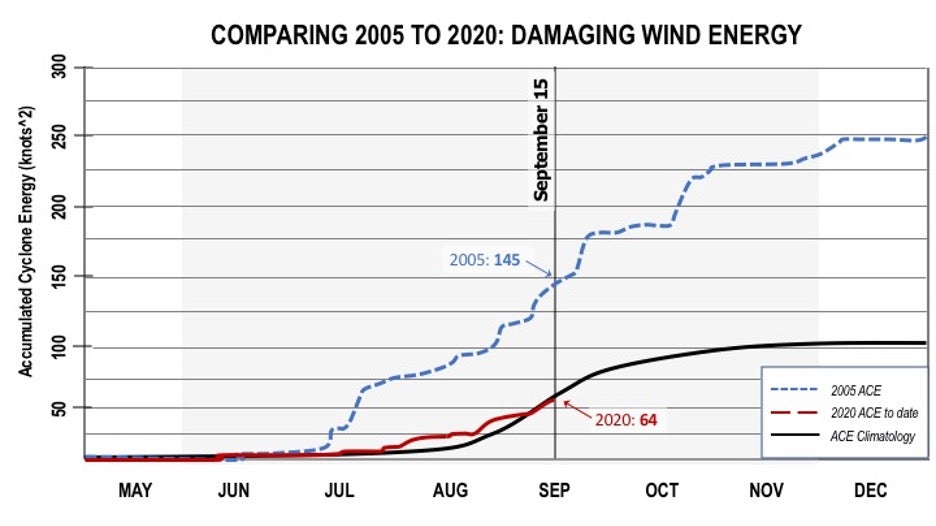
The chart below shows the development of ACE over the 2005 season, eventually reaching a seasonal value of about 250, or 2.5x the average seasonal ACE of 105. The large jumps in the 2005 time series correspond to the intensification of individual storms like Katrina, Rita, and Wilma. But even weaker storms contributed to ACE in 2005. As of September 15, 2005, the ACE index had reached a value of 145, which is 138% of the wind energy expected in an entire season.
In contrast, so far this year, the ACE index has only reached a value of 64, roughly equal to the long-term average (as indicated by the solid black line). The key difference—despite the rapid pace of genesis in 2020—many tropical cyclones this season have been weak and short-lived, which detracts from the total ACE value. In contrast at this point in 2005, three fewer tropical cyclones had developed, but they strengthened and persisted, leading to an ACE value over double that of 2020.
ACE is a useful metric because it applies directly to damage potential as it accumulates each storm’s maximum winds over time. But there’s still an element of damage potential missing in ACE, namely the size of the wind footprint. For example, if we compute ACE for two storms of equal intensity, both lasting for six days, their ACE values will be the same. But if one of those storms is twice the size, it has damage potential over a much wider area. In fact, a storm of equal intensity but with 2x the radius, will produce damaging winds over 4x the area.
To take storm size into account, the TIKE index was developed. TIKE stands for Total Integrated Kinetic Energy and is similar to ACE but incorporates the wind radius of each storm. So, TIKE accumulates the total area over which damaging wind energy is produced for the entirety of each storm’s life cycle and then summed up for the entirety of each storm season. TIKE provides us with a useful metric to compare overall damage potential from one season to the next.
Because accurate and dependable measurements of storm radii have only been available for the past couple of decades, we have a more limited historical record of TIKE. We’ve calculated TIKE over the past 18 seasons, with the results shown in the chart below.
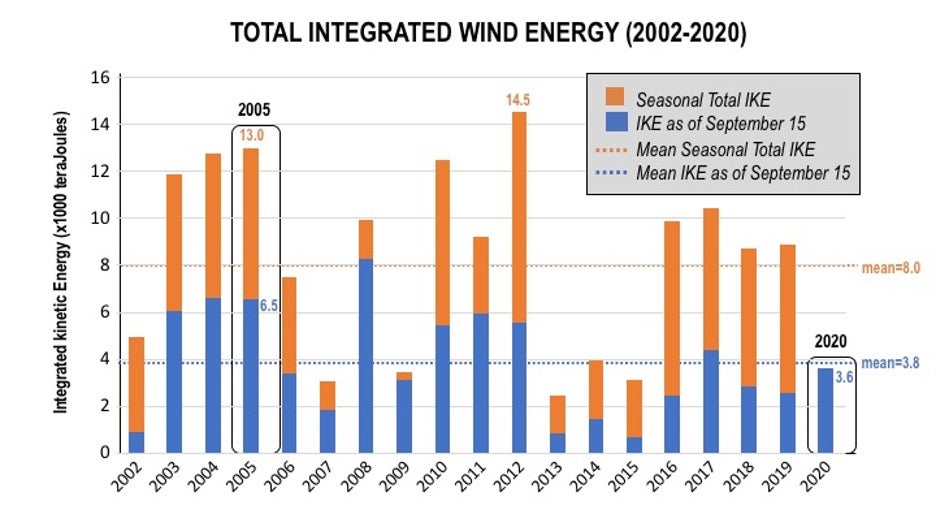
Note, the average seasonal TIKE value over this period is about 8.0 (8,000 terajoules), and the average value as of September 15 is about 3.8 (3,800 terajoules). So, by this point in a typical season, TIKE has accumulated about half of its season total. This is not a surprise given we are near the peak of the hurricane season, and the month of September is well-known for heightened activity in the basin. By the end of 2005, TIKE had reached a value of 13.0, second only to the 2012 season in which Hurricane Sandy’s size, strength, and duration spiked the TIKE value late in that season. In 2005, not only was the wind damage potential extremely high, but much of that potential was realized in the form of landfalling hurricanes producing devastating damage in the Caribbean and U.S.
As of September 15 this year, the TIKE value has reached 3.6, slightly less than the long-term average of 3.8. At this point in September, many seasons over the last 18 years have recorded higher TIKE values, such as 2005 which had already reached a value of 6.5—70% higher than the long-term average and the TIKE value this season.
So, from the perspective of integrated wind damage potential, 2005 eclipses the integrated wind energy so far this year and almost every year since 2002. The exceptions are 2004, another active season with many strong long-lasting hurricanes, and 2008, when by September 15, TIKE had spiked due to long-lasting and strong hurricanes like Bertha and Ike. Again, we see 2005 was truly a remarkable season from virtually every standpoint, and in the most important categories for insurers.
Conclusion
When we look back at the 2020 hurricane season a few months from now, we will question whether reasonable comparisons to 2005 can be made. As of the publication of this blog, 2020 has already made its mark in the number of storms that have formed, and how early they have formed. In fact, every named storm in 2020 has developed prior to its 2005 counterpart. On its face, 2020 appears to be off to an unprecedented start. The Atlantic basin is primed for activity, so as conditions become more conducive in late September and beyond, we should remain vigilant. As Dorian last year showed, it only takes one major hurricane to cause major loss and disruption regardless of overall frequency in the basin.
When we dig a bit deeper and consider metrics important to quantifying damage and loss—namely storm intensity, duration, and size—we quickly realize that the level of wind energy and potential damage generated in 2005 sets a very high bar that will be difficult to surpass. So far in 2020, only seven of 21 named storms have reached hurricane strength, and aside from Laura which reached CAT4 status, the others were relatively weak and short-lived.
While not a topic of this blog, it’s worth noting that 2020, especially early in the season, has been hampered by the so-called “Saharan Air Layer” which restricts the ability of tropical cyclones to intensify in the main development regions of the tropical Atlantic. This was clearly a factor inhibiting storm development in June and July. Now that the SAL is dissipating, activity levels could pick up even further and storms could strengthen even more. All major forecasting organizations expect more hurricanes to form this year.
Ultimately, what matters most to insurers is how much of the potential wind energy translates to actual damage when tropical cyclones track over insured exposure. We know that 2005 produced a number of catastrophic events, most notably Hurricanes Katrina, Rita, and Wilma, in which their potential was realized at catastrophic levels in the U.S. and Caribbean. Since the path that storms take are only predictable on short timescales of hours to days, we cannot predict how many storms that develop in the coming months will make landfall, or how strong, large or persistent they will be. So, we’ll have to wait until later this year to assess the financial impacts of the 2020 season overall and make comparisons to past seasons like 2005.
Click here for more information on the RMS North Atlantic Hurricane Models.