This article was originally published by Reactions Magazine, click here to read the article (Reactions subscribers only).
California has eight-times the population of New Zealand (40 million compared to 5 million), and more than ten times the Gross Domestic Product. California is also geographically around sixty percent larger. Both regions are seismically active. But did you know there is more insured residential earthquake exposure in New Zealand than there is in the state of California, making it one of the most important earthquake insurance markets globally.
Look at two major seismic events. For California, the last major event was the 1995 Northridge earthquake, a Mw 6.7 event that affected the metropolitan area of Los Angeles (population approx. 20 million). The area of strongest shaking was roughly 50 kilometers (30 miles) in diameter and encompassed southern Ventura and northern Los Angeles counties.
Overall about 4,000 buildings were severely damaged or destroyed; another 8,500 were moderately damaged. Communications, water, power distribution and roads were badly affected. Seven major freeway bridges in the area collapsed, and 170 were damaged, disrupting traffic in the Ventura-Los Angeles region for weeks following the earthquake. Insured losses at the time was US$12 billion to US$15 billion, or US$22 billion to US$34 billion today.
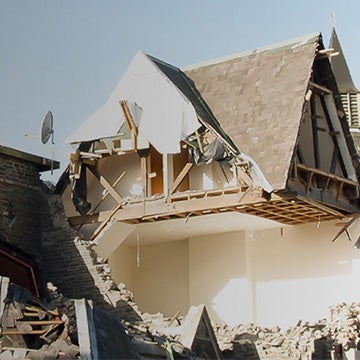
For New Zealand, Kaikoura in 2016 was a major Mw7.8 event, but let’s examine the Canterbury Earthquake Sequence of 2010/2011 which affected the city of Christchurch (pop. ~500,000). Most of the damage was caused by the Mw6.2 event on February 22, 2011. According to the Insurance Council of New Zealand, insured loss for the sequence is in excess of US$20 billion.
So, a larger magnitude event near a city of 20 million in California produced a very similar insured loss to a smaller event near a city of half a million in New Zealand. Why? The similarity in loss has little to do with the physics of the ruptures or details on the engineering of the built environment. The similarity in loss has far more to do with the levels of insured exposure in the two regions, and for (re)insurers with global portfolios, this needs to be explored and understood.
(Near) Blanket Coverage
If a property is not insured, it would obviously not result in an insured loss, and only around 10-15 percent of homeowners in California choose to take out earthquake insurance, which is deemed expensive and deductibles are high. In contrast, earthquake insurance in New Zealand is commonplace as nearly every dwelling is insured and earthquake cover is automatically included in domestic policies. Deductibles are low and premiums are generally affordable, thanks in large part to the existence of the state-backed Earthquake Commission (EQC). The EQC takes a levy on every domestic policy and provides cover for the first NZ$150,000 of earthquake loss.
This difference in insurance penetration explains why New Zealand has more insured residential earthquake exposure. RMS® analyzed the economic and insured exposure of California and New Zealand, and estimated the economic cost of replacing residential exposure in California is 15 to 20 times higher than that in New Zealand; commercial and industrial exposure 8 to 12 times higher. In terms of insurance though, nearly every dwelling in New Zealand is insured for the full replacement value with a small deductible, so when we apply insurance penetration, limits and deductibles we find the residential insured limits at risk are marginally higher in NZ.
For commercial lines, in California, penetration rates are higher than those for residential lines; the state has more commercial insured limits at risk than New Zealand. Even so, while California has 8 to 12 times the commercial economic exposure, it has only three to four times the commercial earthquake-insured exposure.
You would expect more similarities between California and New Zealand, as both regions sit on the Pacific Rim of Fire and experience regular earthquakes. Both communities have well established academic ties in seismic and engineering disciplines; both have modern and well enforced seismic building codes. California’s seismic risk is higher because both its major metropolitan areas sit on top of active faults whereas New Zealand’s largest metropolitan area, Auckland, is situated in a relatively lower seismic setting, but on top of an active volcanic field.
However you look at California and New Zealand, the similarity in exposure does come as a surprise. It is just one of the reasons why RMS spends considerable effort keeping its earthquake models and exposure data for both regions up to date. The RMS New Zealand HD Earthquake Model has been updated and is now available on Risk Modeler.


