2022 proved to be yet another costly year for insurers with over US$100 billion in insured losses from catastrophe events according to Munich Re. And throughout last year, teams from Moody’s RMS Event Response and HWind were busy providing critical insights to our clients, helping them effectively respond to these events.
In this blog, we will review the key events of 2022 using event response footprints that were made available to ExposureIQ clients and examine how this helped in their response.
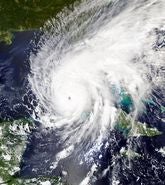
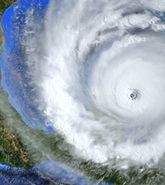
Just one event really stood out in the 2022 North Atlantic Hurricane season with Hurricane Ian making a Florida landfall in late September. During Ian, Moody’s RMS released over 30 accumulation footprints in ExposureIQ with updates starting 72 hours in advance of landfall, right until the storm dissipated.
These footprints are issued up to four times daily for landfalling storms – and offer more detail than regular footprints available via Moody’s RMS Support Center.
The extra detail within the footprints as shown in the ExposureIQ screenshot below provided clients both with a look back and a look forward as Hurricane Ian unfolded, to reflect the retrospective extent of tropical storm- and hurricane-force winds, and the forecast probability of tropical-storm-force winds.
Figure 1: Example of accumulation footprints released on ExposureIQ for Hurricane Ian, representing both the forecast probability of an area experiencing tropical storm-force winds and the retrospective extent of tropical storm and hurricane-force winds already experienced throughout the storm’s lifecycle.
Using this insight, our clients using ExposureIQ were able to better understand the range of locations that could be affected given the high uncertainty in Ian’s track up to two days before landfall – and more quickly identify areas affected by hurricane-force winds immediately following landfall.
Following Hurricane Ian, footprints representing the wind, storm surge, and tropical cyclone-induced flooding hazard – banded by severity, were made available within the ExposureIQ application to provide a comprehensive view of the impact of each sub-peril.
In addition, ExposureIQ integration with HWind forecasts, snapshots, and footprints offers clients even more detailed and frequent insights into the future, current, and past impacts of hurricanes. More information on how HWind can be utilized within ExposureIQ in response to events such as Hurricane Ian can be found in this blog.
In the Western North Pacific Basin, accumulation information for Typhoons Chaba, Hinnamnor, Muifa, Nanmadol, and Noru was made available on ExposureIQ, with footprints representing the areas affected by Moody’s RMS stochastic event selections.
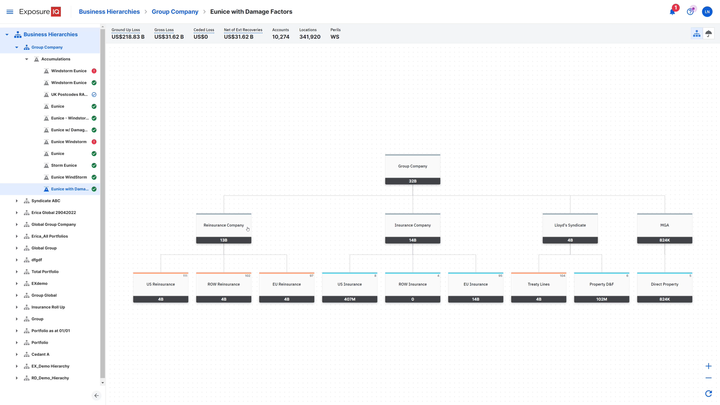
Customers enrolled in the Business Hierarchies preview program were also able to apply these high granularity footprints across the entirety of their reinsurance portfolio, as well as their inwards book, to assess impacted cedants and estimate losses across the whole company with unparalleled efficiency and detail.
This functionality will become generally available before summer 2023, for clients to leverage in the next hurricane season and beyond.
Figure 2: ExposureIQ Business Hierarchies
Europe Windstorm
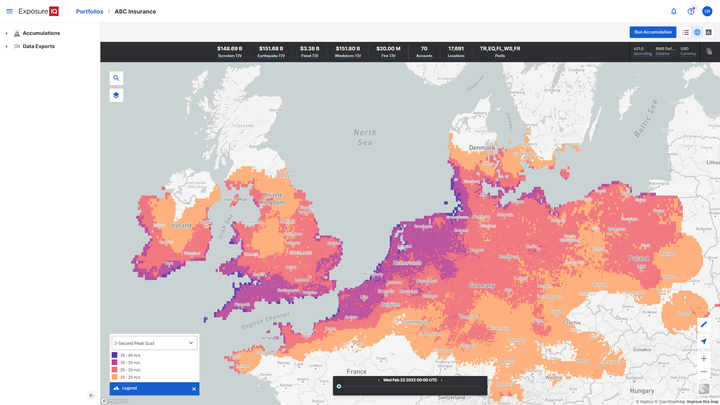
In February 2022, a series of damaging windstorms swept across northwest Europe within the space of a week: Dudley, Eunice, and Franklin (also known as Ylenia, Zeynep, and Antonia).
For each of these windstorms, Moody’s RMS reconstructed the wind field and provided an accumulation footprint banded by wind speed on ExposureIQ to enable more granular insights into the severity of hazard experienced at different locations from these events.
Figure 3: Wind hazard reconstruction of Windstorm Eunice/Zeynep within ExposureIQ
Earthquake
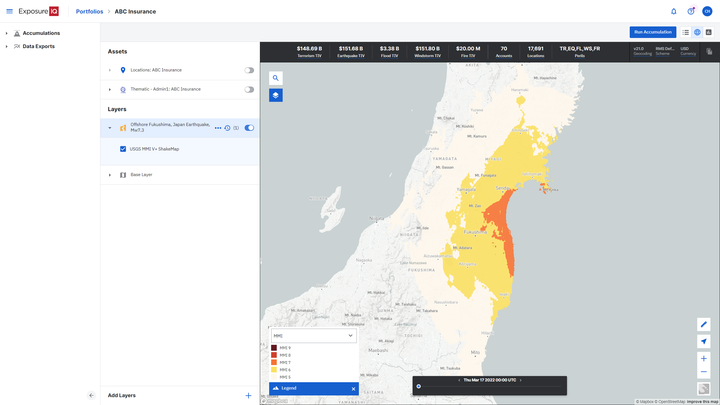
Earthquake disasters were relatively muted in 2022 but the Mw7.3 earthquake in mid-March near Fukushima, Japan stands out as the most significant.
Moody’s RMS provides a ShakeMap footprint banded by Modified Mercalli Intensity (MMI) from the United States Geological Survey (USGS) on ExposureIQ for all major earthquake events with a shaking intensity of over MMI V – events which can cause significant damage if impacting a populated region.
Our Event Response team published footprints for more than 10 earthquake events in 2022.
Figure 4: Banded MMI USGS MMI ShakeMap on ExposureIQ for the 7.3 Mw Offshore Fukushima, Japan Earthquake in March 2022.
Flood
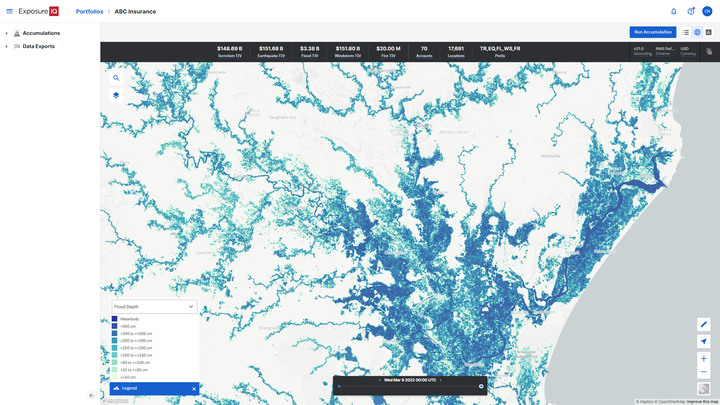
The most significant flood events of the year occurred in Australia with a third consecutive year of La Niña supporting conditions conducive to record-breaking rainfall. The flooding in New South Wales and Queensland in February and March driven by three consecutive East Coast Lows was the costliest insured natural disaster in Australia’s history, surpassing the 1999 Sydney Hailstorm.
Moody’s RMS was able to use its Global Flood Maps to provide flood extent and hazard severity information on ExposureIQ, with footprints validated against media reconnaissance, flood depth data, and satellite imagery. Other 2022 flood event footprints made available in ExposureIQ include flooding in the Central and Eastern U.S. in July and the Southern U.S. in August.
Figure 5: Subset of the event response flood hazard footprint for the 2022 Eastern Australia Floods within ExposureIQ, focused on Lismore, Queensland, based on the Moody's RMS Global Flood Maps.
Wildfire
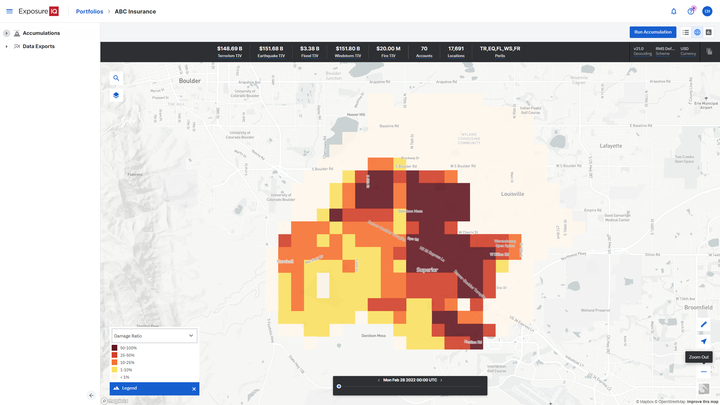
Across the U.S., 2022 was not nearly as destructive or damaging as recent years despite an above-average number of fires and area burned. Only a handful of fires damaged more than 200 properties, most notably the Marshall Fire in Colorado at the start of the year and the Hermit’s Peak/Calf Canyon and McBride fires in New Mexico in April.
For all significant fires such as these, Moody’s RMS publishes accumulation footprints of the fire and burn areas on ExposureIQ. This enables users to quickly understand which locations may be impacted and the exposed limit within these affected areas.
Given the significance of the Marshall Fire, with over 1,000 structures destroyed, Moody’s RMS reconstructed the event’s hazard and ran this through Moody’s RMS North America Wildfire HD Model to generate an accumulation footprint banded by damage factor. Within ExposureIQ this enabled users to get an estimate of their losses from this event.
Figure 6: Damage ratio accumulation footprint for the Marshall Fire, Colorado within ExposureIQ
In comparison to other regions of the U.S., the wildfire season in California was relatively subdued despite predictions pointing toward another significant and destructive year. However, there were still several notable fires including the Oak, McKinney, Mill, and El Dorado fires.
Throughout the wildfire season (July through November), accumulation layers detailing both the active wildfire perimeters and all fire and burn areas to date across three states – California, Oregon, and Washington – were released daily on ExposureIQ to support the response of our clients to fires like these.
Severe Convective Storms and Winter Storms
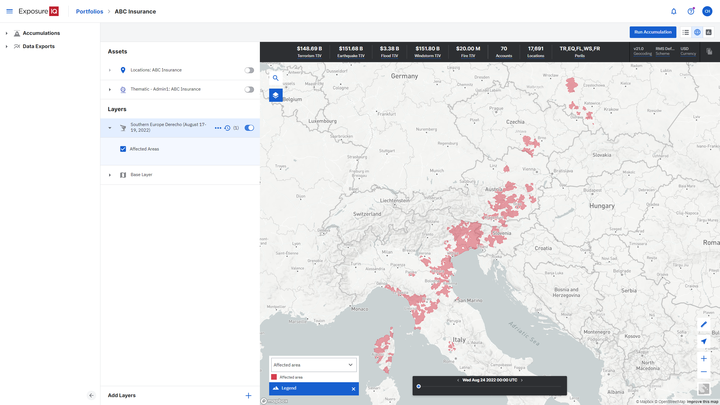
While the costliest severe convective storms of the year were the series of hailstorms between May and July in France, southern Europe was also impacted by a derecho in August and several notable storms also affected the U.S.
For severe convective storms, Moody’s RMS provides footprints on ExposureIQ representing the areas affected by hail, tornados, and straight-line winds based on Storm Prediction Center storm reports in the U.S. and European Severe Weather Database reports in Europe.
Figure 8: Accumulation footprint within ExposureIQ of areas affected by the Southern Europe Derecho in August 2022
Similarly, for the December winter storm and cold air outbreak event in North America, an accumulation footprint representing the areas affected by freeze hazard was released on ExposureIQ.
Summary
Event response represents a critical time for exposure managers to demonstrate to their internal leadership teams and external stakeholders such as regulators, reinsurers, and capital providers, that they can perform efficiently and generate high-quality insights.
As the events of 2022 demonstrate, event response footprints on ExposureIQ provided the ability to respond effectively to a wide range of perils in real-time with clients having instant access to more frequent and detailed accumulation information, allowing for faster estimation of impacted clients and expected losses.
ExposureIQ is also providing a valuable database of historical events, and as of March 2023, over 500 event response accumulation footprints are now available on ExposureIQ for 95 past events.
As this catalog of accumulation footprints continues to grow, it enables clients to assess how exposed their current portfolio would be if similar events might occur today. These insights can be used alongside regular zonal accumulation reporting to ensure that accumulations are managed to avoid any unexpected losses.
Moody’s RMS customers can download the full-length report - Moody’s RMS Event Response: Catastrophe Review 2022 from Moody’s RMS Support Center for a detailed recap of the events of 2022.
Callum is the product manager for Moody’s RMS Event Response Services (including HWind) and Agricultural Models and is based in London. Most recently he has been focused on improving client workflows through the integration of event response functionality within the Intelligent Risk Platform.
Previously, Callum has worked on climate change initiatives at Moody’s as well as the 2018 update to the Australia Cyclone Model.
Callum is a Certified Catastrophe Risk Analyst and holds an integrated master’s degree (MEarthSci) in Earth Sciences from Oxford University.