Moody’s RMS HWind: How to Reduce Basis Risk When Selecting a Parametric Trigger
Callum HigginsJune 26, 2023
When a catastrophic event such as a hurricane occurs, it can have a significant and wide-ranging impact on a region. Away from the tragedy of human casualties and injuries, homes, businesses, and infrastructure can experience direct damage.
Utilities are disrupted, residents are displaced, businesses lose revenues, and local service provisions from healthcare to education face interruption.
A traditional indemnity insurance policy focuses on recompensing a property or asset owner on the losses incurred to repair or replace their asset – and this is vital for providing the funds to rebuild.
But, it can take time for damage to be assessed and for the required funds to be released, and significant non-damage losses can occur, ranging from business interruption, loss of employee earnings, or if a manufacturing plant struggles to restart due to power outages.
To kick-start normality for a business after a catastrophe, an immediate injection of cash delivered without delay is required.
Use of Parametric Policies
As an alternative to these mainstay policies that indemnify an actual incurred loss, parametric (or index-based) solutions are not linked to any underlying physical asset but are a type of insurance that covers the probability of a predefined event happening, such as a hurricane impacting a specific area.
When the trigger event happens, funds can be released to the insured by the insurer to quickly restore vital business activities, for instance.
In its simplest form, a parametric policy is an agreement to make a specific payment when pre-defined event parameters are at least met (triggered) or exceeded and are used by corporates to access coverage for defined risks and fill protection gaps in an increasingly risky environment.
For a hurricane, a trigger could be if a hurricane at a certain peak wind strength enters a pre-defined area.
Parametric insurance is a growing market, and according to analysts Allied Market Research, the global parametric insurance market was valued at US$11.7 billion in 2021 and is projected to reach US$29.3 billion by 2031, growing at a CAGR of 9.9 percent from 2022 to 2031.
Focus on Trigger Methodologies
Much of the focus around a parametric policy is on the trigger methodology – in terms of what needs to happen for a policy to pay out.
Selecting the most appropriate trigger is important as using an inappropriate trigger can result in basis risk, where the expectation of the policy from the client doesn't match what they thought they would be paid out.
For hurricanes, the most commonly used trigger methodologies, such as ‘cat-in-a-box’ – when a tropical cyclone of a specified peak strength enters a pre-determined area (or ‘box’), can come with significant basis risk as these approaches only consider the peak intensity of the storm and do not sufficiently consider the actual wind speeds experienced at a location.
Take the example of a hotel location. For a simple ‘cat-in-a-box’ trigger, as long as a hurricane tracks through the box above a specified intensity the policy will pay out the same amount whether the maximum winds of the storm pass close to the location resulting in significant damage or they are further away with relatively weak winds and little damage experienced at the hotel.
In a new white paper, we explore how Moody’s RMS clients such as Swiss Re and AXA Climate are using HWind, which for over 25 years has delivered high-quality data for assessing damaging characteristics of tropical cyclones during and after landfall.
The wealth of knowledge HWind offers has helped proliferate its widespread usage as a parametric trigger for commercial insurance contracts in the industry today.
HWind data products produce real-time and historical wind field analyses in the western North Atlantic, East Pacific, and Central Pacific Basins, along with real-time wind and storm surge forecasting products for the North Atlantic Basin.
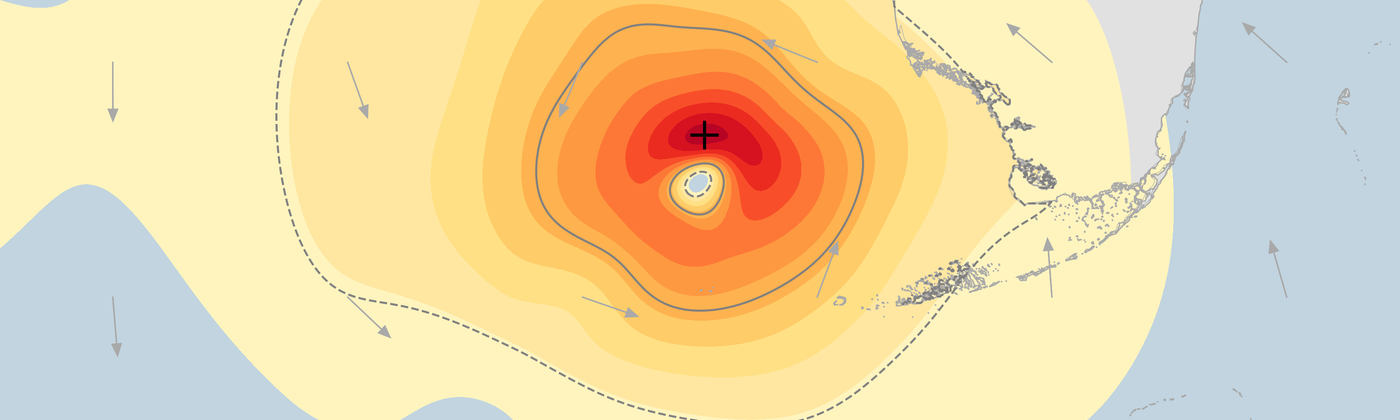
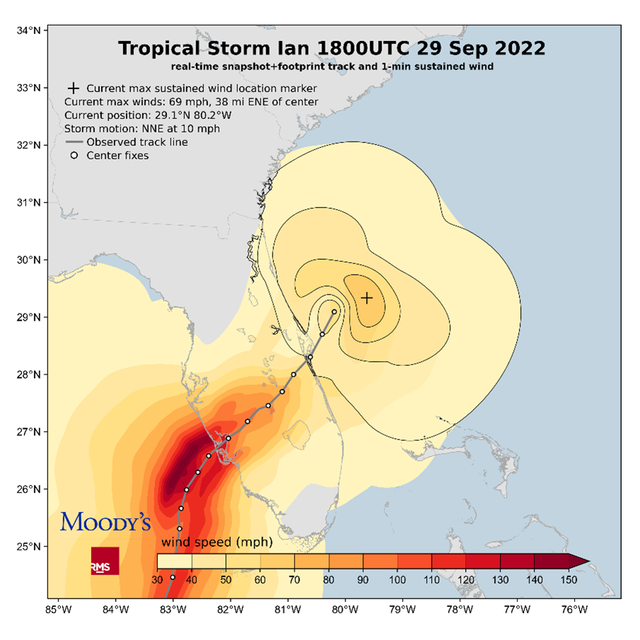
For parametric policies, insurers use HWind cumulative footprints as a trigger to help minimize basis risk, with HWind footprints providing a swath of the maximum wind speeds experienced during the storm (Figure 1).
Figure 1: HWind cumulative footprint of Hurricane Ian as of September 29, 2022, at 18:00 UTC
During a tropical cyclone, HWind snapshots represent instantaneous views of a storm’s wind field and are created every six hours through its life cycle. These are the building blocks used to create the final footprint of a storm’s maximum winds.
To generate these snapshots, HWind ingests observational data from more than 30 sources, including satellite data, aircraft reconnaissance, buoys, and land-based anemometers, as the data becomes available. This results in tens of thousands of individual measurements for each event. Usually, each snapshot reflects a six-hour data window before the valid snapshot time.
Creating an HWind Cumulative Footprint
To create a snapshot, all relevant wind speed observations are standardized to represent the one-minute sustained wind at a height of 10 meters above the surface. In addition, the track of the storm is defined using a combination of existing track data and these detailed observations.
Then, as part of this process, meteorological analysts manually check the quality of the wind observation data. They remove any poor-quality data points, for instance, those inconsistent with surrounding observations or those likely to have been contaminated by rainfall.
The final footprint is released within one to three days of the conclusion of the event. By relying on an extensive network of observational data to reconstruct a storm’s wind field at a high resolution, wind speeds experienced at a specific site can be closely represented.
HWind encourages quick evaluation of hurricane trigger/payout conditions, enabling parametric policyholders to have rapid access to capital following impactful events.
Many parametric policies for hurricane use publicly available information from organizations such as the U.S. National Hurricane Center (NHC).
But NHC information typically only includes the overall characteristics of the storm, such as the peak intensity, radius to maximum winds, or broad bands of hazard representing the areas of tropical storm and hurricane force winds.
For determining the precise wind speeds experienced at a location, NHC information is unsuitable on its own.
The Advantage Over Public Data Sources
One key advantage of HWind footprints as a parametric trigger for insurance policies, rather than publicly available information from the NHC, is the granular nature of the data.
Cat-in-a-box or circle trigger methodologies rely purely on peak intensity estimates to circumvent the challenge of using publicly available information.
However, significant basis risk is introduced, with the potential for the storm’s maximum wind speed to differ substantially from wind speeds at the site of interest.
Using HWind, wind speeds (in miles per hour) are measured to two decimal places at a resolution of one kilometer by one kilometer. This enables accurate identification of the actual wind speeds experienced at a location, minimizing the basis risk.
In our white paper, we explore how HWind could have triggered a parametric insurance contract in the wake of Hurricane Ian in 2022, for a single hotel location.
To find out about this example, and more information on how HWind is used as a parametric trigger and its benefits compared to other triggers, download our new white paper here.
whitepaper: Using Moody’s RMS HWind as a Trigger for Parametric Insurance Contracts
Learn More
Callum Higgins
Assistant Director - Product Management, Moody's
Callum is the product manager for Moody’s RMS Event Response Services (including HWind) and Agricultural Models and is based in London. Most recently he has been focused on improving client workflows through the integration of event response functionality within the Intelligent Risk Platform.
Previously, Callum has worked on climate change initiatives at Moody’s as well as the 2018 update to the Australia Cyclone Model.
Callum is a Certified Catastrophe Risk Analyst and holds an integrated master’s degree (MEarthSci) in Earth Sciences from Oxford University.