2018 Atlantic Hurricane Season: Your Questions Answered
Jeff WatersNovember 02, 2018
I had the privilege of joining Property Casualty 360 for a Facebook Live video discussion last week, together with my colleague Wallace Hogsett, client manager at RMS. Danielle Ling, associate editor at PC360 was the host of the discussion, entitled “2018 Hurricane Season: Where Are We Now?”.
We began by providing a perspective on the impacts of this season’s hurricanes. The two big hurricane events to impact the U.S. in 2018 (so far) have obviously been Hurricanes Florence and Michael, but each possessed very different characteristics. Florence maintained Category 4 status on the Saffir-Simpson Hurricane Wind Scale (SSHWS) for around a week, before wind shear tempered it to a Category 1 as it made landfall near Wrightsville Beach, North Carolina on September 14. While many areas were subject to significant wind gusts and storm surge, Florence was primarily a flood event, causing historic rainfall and inland flooding throughout the Carolinas.
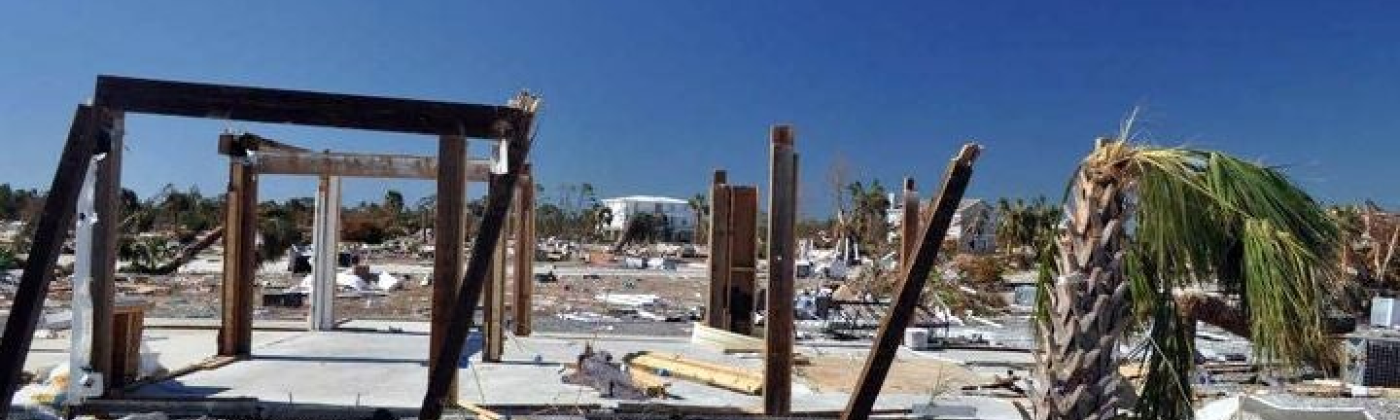
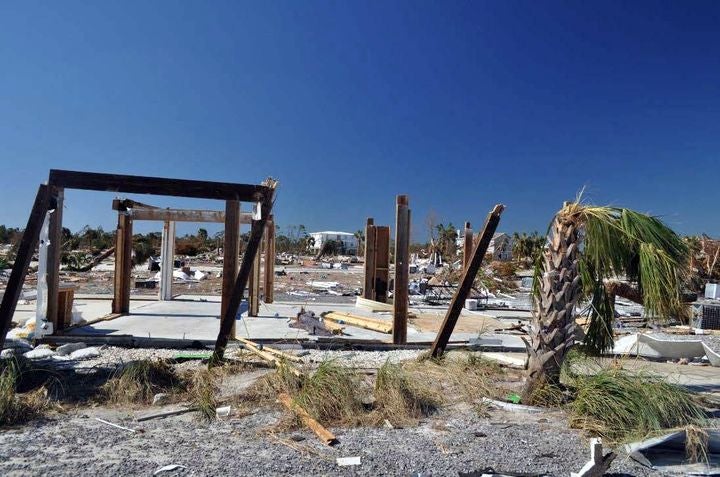
On the other end of the scale, Wallace stated how Michael was a classic intense hurricane — the most intense to make landfall in the U.S. since Andrew in 1992 — almost reaching Category 5 status upon its landfall in Mexico Beach on October 10. The scenes of structures reduced to their “slabs” with just their foundations left showed that this was primarily a wind and storm surge event. In total, damages stretched from the Florida Panhandle region through the Southeast and the Carolinas.
A slabbed house in Mexico Beach, Florida, after Hurricane Michael. Image source: RMS Reconnaissance Team
With such polarizing event characteristics between Florence and Michael, our audience wanted to know where the biggest threat traditionally comes from with regards to hurricane hazard: wind, storm surge, or inland flood? This is an interesting question, as historically hurricane severity has been a function of peak wind speed, graded using metrics such as the SSHWS. However, as we saw with the Harvey, Irma, Maria (HIM) events in 2017, and with Michael and Florence in 2018, surge and precipitation-induced flooding can also be material drivers of loss. It has also prompted interest in considering other metrics to reflect tropical cyclone destruction potential, such as Integrated Kinetic Energy. Overall, hurricane loss driver(s) really depend on the individual event characteristics, the geographic region(s) impacted, and the exposure profiles therein.
On balance, we have discussed the shift towards flood driving more of the total hurricane losses; back in 2014, Robert Muir-Wood, chief research officer for RMS, asked that exact question — “Is Water the New Wind?”, as Ivan, Katrina, and Superstorm Sandy racked up higher percentages of storm surge-driven losses. Each of these events, as well as Florence and Harvey more recently, exposes the protection gap that exists for flood insurance in the U.S. National Flood Insurance Program (NFIP) take-up rates tend to be highest near the coast or in particularly flood prone areas, also known as FEMA Special Flood Hazard Areas (SFHA). However, further inland the NFIP take-up rates drop substantially, meaning that the majority of flood-driven losses in non-coastal areas tend to be uninsured, especially for residential lines.
Danielle received questions from the audience as to why modelers release historical benchmarks for events such as Florence and Michael, to show similar past events. How can these benchmarks help (re)insurers with hurricane risk on their books? Wallace and I explained that modelers such as RMS release historical benchmarks to help clients get an initial view of potential impacts before landfall. The benchmarks are useful because they are tangible events that the market has experienced before, thus giving them something tangible to compare against. RMS always offers a range of scenarios to reflect the uncertainty of the event characteristics and possible impacts pre-landfall.
Next, our audience stressed how insurers play a vital role in helping communities build back and strengthen after devastating hurricane damages and wondered how these communities can mitigate and protect against future impacts.
One key theme in building community resilience is the value of becoming more proactive than reactive. Communities can do that by utilizing available risk data to understand what perils their area is exposed to, and to what extent. Similarly, it behooves communities to understand the full extent of local building codes and enforcement practices, as well as mitigation options for existing or new structures. A great program to help with risk mitigation is the IBHS FORTIFIED program, which is designed to help communities strengthen homes and businesses against hurricane winds and other natural catastrophes. Collectively, information like this can help communities understand where to build new structures, how to build to code, and determine cost-effective mitigation options, all of which help minimize risk from future natural disasters.
At this point the conversation shifted back to understanding real-time event impacts, particularly the sources of uncertainty when quantifying these impacts. Below are a few examples.
One source of uncertainty is in understanding the way buildings respond relative to the building codes in place. Even with perfect rules and enforcement, structures will not always respond exactly the way they were designed, nor will identical structures respond the same way when exposed to the same hazard. Another source is via the density and reliability of observational data, and how any data gaps are minimized. For instance, in Hurricane Michael many weather stations were damaged or lost power and consequently failed to record the peak wind gusts. RMS filled this gap and quantified the observed winds in these areas by using RMS HWind data, which incorporates additional data sources beyond ground-based stations (e.g. airborne, satellite, and marine data types). Uncertainty can also stem from needing to quantify the prolonged effects of an event before they have fully played out, such as power outages or claims inflation, both of which can amplify overall event costs.
Danielle followed-up by asking how RMS and the broader market learns from each event. With events such as Florence and Michael, how can the insurance industry incorporate any lessons learnt, and in terms of risk modelers, how are insights incorporated into catastrophe models?
Wallace and I recognized that every event is a great opportunity for modelers to benchmark and validate model assumptions, methodologies, and output. RMS often sends field reconnaissance teams onsite to survey damage and collect important information about the event impacts. For instance, after Hurricane Michael reconnaissance teams discerned key differences in property damage between older buildings not conforming to the latest Florida Building Code, and newer buildings. As for the market, we provided some best practices based on observed impacts from recent events, such as the importance of understanding exposure composition, distribution, and correlation as completely as possible to limit potential surprises.
As we approach the end of the Atlantic hurricane season, RMS will continue to help clients and the wider industry understand the impacts and learnings of this year’s events. Thank you again to PC360 and everyone who took part in this live-stream event.
Share:
You May Also Like
October 24, 2024
Hurricane Milton (2024): Location of Peak Winds at Landfall
Jeff Waters joined Moody's RMS in 2011 and is based in Bethlehem, PA. As part of the Product Management team, he is responsible for product management of the Moody's RMS North Atlantic Hurricane Models.
Jeff provides technical expertise and support regarding catastrophe model solutions and their applications throughout the (re)insurance industry. He also generates product requirements for future updates and releases, and helps develop the overall product strategy, messaging, thought leadership, and collateral to ensure its commercial and technical success.
Waters’ background is meteorology and atmospheric science with a focus in tropical meteorology and climatology. Jeff holds a B.S. in Geography/Meteorology from Ohio University (’09), and a M.S. in Meteorology from Penn State University (’11). He is a member of the American Meteorological Society, the International Society of Catastrophe Managers, and the U.S. Reinsurance Under 40s Group, Inc