When I was a kid, my favorite breakfast cereal was Kellogg’s Sugar Frosted Flakes. As a teenager in the 1980s, I recall that the name changed to Frosted Flakes. In 1983, to appeal to a more health-conscious consumer, Kellogg simply dropped “sugar” from the name. And around the same time, Kellogg’s Sugar Smacks became Honey Smacks. There didn’t seem to be a dramatic reduction in sugar. Even today, sugar makes up over 55 percent of the total content of Honey Smacks and is the lead ingredient. Honey trails at fourth. The idea was … if the consumer didn’t see the word sugar, they wouldn’t necessarily jump to the conclusion that it was loaded with sugar. One could argue that this was just a marketing ploy – yet most would agree it secured marketing appeal by removing a potential distraction from its name.
At around the same time, during the late 1980s, what was scientific convention in the use of the term “global warming” had shifted to “climate change.” The term “global warming” – referring to increasing global surface temperatures due to greenhouse gas (GHG) emissions – was first used in a 1975 Science article entitled “Climatic Change: Are We on the Brink of a Pronounced Global Warming?” authored by geochemist Wallace Broecker of Columbia University.
Dr. Broecker’s term was a break from earlier studies of man’s impact on climate, which had instead referred to “inadvertent climate modification.” At the time, while many scientists accepted that human activity could cause climate change, they did not know if the result would be warming or cooling. It was theorized that industrial emissions of certain aerosols (chlorofluorocarbons or CFCs) could cause cooling, while GHG emissions (like carbon dioxide or CO2) could cause warming. But it was not known which would dominate, and modern climate models were not available to help answer that question. So “inadvertent climate modification”, while sounding clunky and overly technical, was an accurate reflection of the science of the day.
Communicating Climate Science
Through the 1980s and into the 1990s, a colloquial shift from the term global warming to climate change occurred – more organically than the name change of my favorite cereal, yet the effect was much the same. By removing the distraction – warming – one could focus on the issue at hand, namely our complex and changing climate, rather than the simplistic notion of warmer temperatures, which to some might sound rather appealing.
The importance of how we choose to communicate climate science cannot be underestimated. Is it simply a matter of warmer temperatures globally, or is our climate changing in other ways that extend beyond temperature to other hazards and effects? It is now clear that a globally trending warmer climate has far reaching effects well beyond warmer weather. Some effects are more obvious than others, like the more frequent dry or “drought-like” conditions that can fuel longer-lasting and more devastating wildfires such as those experienced earlier this month in California.
From a health perspective, more wildfires mean poorer air quality. It is estimated that in some parts of California, breathing the air during peak fire conditions was like smoking a half-pack of cigarettes per day. This is just one example that connects the direct result of warming (drier vegetation) to a hazard (more wildfires) to an impact on well-being (detriment to health). It’s more than global warming; it’s a disruptive change in climate.
As a result of this terminology change from the 1980s, young people today are less likely to assume that climate change simply and automatically refers to a global warming, partly thanks to more effective communication of climate science to the layperson. This has one distinct advantage which is not to confuse a cause (human activity) with an effect (warming of an already changing climate). In other words, global warming is one example of a change in climate, but our climate is by definition non-stationary. To manage the risks, it’s important to understand both the causes and the effects of change.
NCA4
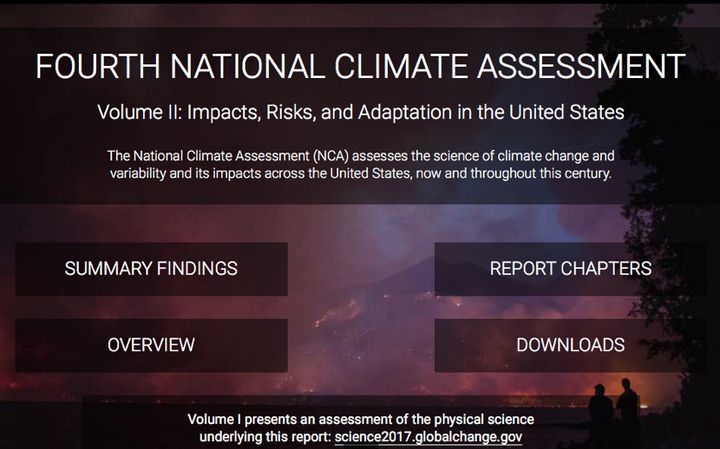
On the Friday after Thanksgiving, the U.S. Government released the final part of the Fourth National Climate Assessment also known as NCA4. This assessment is required by U.S. law, as per the U.S. Global Change Research Program (USGCRP), enacted by Congress in the Global Change Research Act (GCRA) of 1990. Its mandate is to develop and coordinate “… a comprehensive and integrated United States research program which will assist the Nation and the world to understand, assess, predict, and respond to human-induced and natural processes of global change.”
U.S. Global Change Research Program: Fourth National Climate Assessment website screen
One of the outputs mandated by the GCRA is a quadrennial assessment submitted to the President and the Congress, referred to as the National Climate Assessment (NCA). This fourth assessment (NCA4), was produced in two volumes. Climate Science Special Report (NCA4 Vol. I) was released in 2017, and Climate Change Impacts, Risks, and Adaptation in the U.S. (NCA4 Vol. II), was released on November 23, 2018.
NCA4 Volume I is a detailed scientific analysis that evaluates climate trends and uncertainties, and projects future trends over the coming 25 to 100 years. NCA4 Volume II uses the assessment from Volume I to inform an analysis of the impacts on the natural environment, agriculture, energy use and production, land and water resources, transportation, human health and welfare, social systems, and biological diversity.
The NCA4 report contains several important implications for risk management and the global insurance industry. It considers “low-probability, high-consequence, climate futures” and in doing so puts forth plausible scenarios of increasing risks and costs to insurance and correlated sectors including agriculture, energy production, health and recreation. RMS experts are reviewing the latest report, along with Volume I released last year, to provide our clients with an executive summary that distills its most important findings pertaining to insurance and risk management. We are also reviewing other recently released governmental reports on climate change, including the UKCP18 report and the Swiss CH2018 Climate Change Scenarios report, and will be reporting back to our clients with summary findings and implications for our industry.
NCA4 is a lengthy and content-rich report that addresses a spectrum of issues and concerns. Before interpreting its findings, it is important to establish a baseline of understanding around weather, climate, and climate change. At RMS, we take our role as communicators seriously, and feel it is important to convey the facts, explain the opinions, and quantify the uncertainties. We feel it is equally important to clarify scientific fact from scientific speculation and focus on how we can move forward and help our clients make informed decisions in the face of scientific uncertainty. It is also important to help move the debate from the basics.
Does Climate Change Exist?
This is like asking does climate exist? Yes, it is definitional. It is the name given to changes in Earth’s climate system. And since climate itself is defined as a long-term “statistical” representation of the Earth’s atmosphere, then by definition, with the passing of each day of weather and every minor and major weather event, the statistics change and in turn, so does the statistically-defined climate.
Let’s use a simple baseball analogy. Babe Ruth’s lifetime batting average was 0.342. Each year in Ruth’s 22-season career was different. For example, in 1923 he hit for his highest single-season average of 0.393. But there were some games that Ruth had no hits at all. Those games dropped his lifetime average. In other words, with every at-bat, Ruth’s lifetime average changed. Now, consider each baseball game is weather, each season is a year of weather events, and Ruth’s complete history, his lifetime average, is climate. Throughout his career, Ruth’s “batting climate” was constantly changing because by definition each at-bat changed his long-term batting statistic.
The point is that climate change in itself is not a scary prospect. If the climate was not changing, there would be no need to track it. Each year would come and go without any deviation from the prior year. There would be no records broken because historical experience would repeat itself on a regular and predictable schedule. We all know the weather doesn’t work that way. When high temperature records are being broken regularly, on a daily, monthly, and seasonal basis, it means the average high temperatures are on the rise, a specific mode of climate change.
Here’s where a common climate fallacy comes in. A fallacy is an error in logic. Using a single weather event to confirm or contradict any statement about climate is drawing a statistical conclusion based on a single data point. It would be like saying, “Babe Ruth was off his game today, he went 0-for-4! Whatever happened to that 0.342 average?” Like many fallacies, there is an element of truth here. In fact, that day, Ruth’s poor batting did drop his running lifetime average a bit. But, the important thing would be if Ruth continued season after season to bat poorly, then in fact his long-term batting average would severely drop and would be a statistically important trend supported by sufficient data.
Social media campaign from the World Wildlife Fund highlighting that 97 percent of climate scientists agree that man-made climate change exists
So just as Babe Ruth had his “bad days”, and we expect that, so too will a warming climate have its “cold days”. The important question is what are the long-term statistics telling us? By nearly every reputable climate scientist worldwide, the global climate is currently warming, and weather is becoming more extreme. The first half of the statement is the more direct one – global temperatures are on the rise and there is sufficient data to support that conclusion. Remember, this is the global average, so some places may actually be cooling, or warming more gradually. But overall, a 1.8-degree Fahrenheit (1 degree Celsius) temperature increase since 1900 as noted in NCA4 is very significant when averaged over such a large area as the U.S. Raising the temperature of the planet by one degree Celsius (1.8 degrees Fahrenheit) requires about five exajoules (5,000,000,000,000,000,000 joules) of energy. That’s the equivalent of total energy consumption of the U.S. for about four million years. A small rise on the thermometer averaged over such a large area translates into a huge rise in energy.
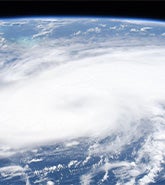
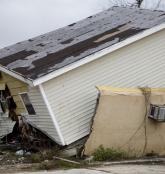
The relationship between these warming temperatures and the frequency of extreme weather events, such as wildfires, floods and hurricanes, is more difficult to quantify. What we do know is that meteorologically, storms are fueled by energy in different forms. So, one might automatically expect that more energy means more storms. It may not be that simple, since Earth’s atmosphere has natural “feedbacks” or counteracting mechanisms that could limit how much of that energy translates into more storms. Most scientists agree that even if storm frequency doesn’t increase, those storms that do form will draw from a larger pool of energy and have the potential to become stronger and much more destructive. These are difficult scientific questions with real-life implications. RMS’ robust suite of catastrophe models are today’s best available tools for quantifying the financial implications of climate change.
Catastrophe models quantify the relationship between the frequency and severity of insured perils and their potential range of financial impacts (both economic and insured). Because the models are robust enough to account for “tail events”, namely low probability, high impact events, they already account for storms (like Cat 5 hurricanes) which may become more frequent and/or more severe. By applying the latest climate science to the output from CAT models, sensitivity testing can help quantify the risks of future climate change. More importantly, CAT models account for the risk in “today’s climate” and in turn can provide a view of “climate change so-far” which is most pertinent to managing today’s risks.
What’s Next
Obviously, an informal blog cannot do justice to the topic of climate change and its relationship to extreme events and insured risk. My colleagues and I at RMS will be extending this blog and publishing a series of briefings called “Climate Change and Risk Management.” Our goal is to provide an independent view of issues important to our clients, educate and expand on the latest climate science, and engage on topics that relate climate change to catastrophe modeling for a range of climate perils.
Dailey is VP, Model Development at RMS and has served the CAT modeling industry for 20 years. He is responsible for delivering Global Event Response products to RMS clients before (forecast products), during (real-time response) and following (event reconstruction) all major natural catastrophes worldwide.
Pete manages teams in London, U.K. and Florida, dedicated to providing 24/7/365 support as events unfold. Pete is also actively involved in formulating RMS’ strategy for developing climate change risk analytics and solutions.Pete has presented and published on various topics important to risk management including tropical cyclones, severe convective storms, coastal and inland floods, and the relationship of our changing climate to the dynamic landscape of insured and economic risk.
Pete holds degrees in Econometrics and Systems Engineering from Penn and a M.S. and Ph.D. in Atmospheric Science from the University of California, Los Angeles.