New Zealand Earthquake: How the Last Decade Has Changed Everything
Laura BarksbyApril 24, 2020
Go back to this time 10 years ago and earthquake risk in New Zealand was a relatively low priority for the global (re)insurance industry; a decade later, and this perspective has certainly changed. Insured losses of around NZ$40 billion (US$24.1 billion) came from the 2010-2011 Canterbury Earthquake Sequence (CES) and the 2016 Kaikoura earthquake; the former is the world’s second largest earthquake insured loss.
These events had a considerable impact across all aspects of society in New Zealand. They have also radically changed how seismic risk is viewed and managed, as vast volumes of scientific and engineering data was generated from these events. This data has enabled RMS to apply advanced modeling methodologies and rebuild all model components to provide a comprehensive, well calibrated view of New Zealand earthquake risk.
Understanding Liquefaction
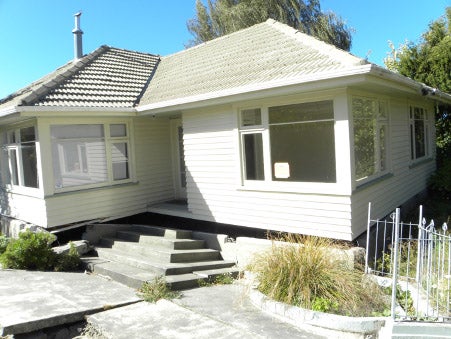
Dramatic images of liquefaction from the February 2011 earthquake in Christchurch showed vast areas of damage. Homes were pulled apart by liquefaction that engulfed people’s cars parked on their driveways, while other buildings were left tilted at precarious angles due to differential settlement. There were notable local variations in liquefaction severity as some properties experienced significant damage, whereas others in the same neighborhood had little to no damage. 2011 produced some of the widest spread liquefaction in a built-up area in the developed world. As a result, the CES emphasized the importance of high-resolution modeling of the different forms of liquefaction to truly understand the impacts of this peril.
Image: House in Christchurch torn from its foundations by liquefaction. This photo was taken during the RMS reconnaissance trip to Christchurch following the February 22, 2011, event.
From a source model perspective, the CES prompted an update to the country’s National Seismic Hazard Map. As part of this release, RMS conducted its own research, including other types of events that could impact New Zealand and affect tail risk – such as the possibility of earthquakes that rupture multiple interlinking faults, rather than rupturing faults individually. RMS shared its findings with GNS Science, who acknowledged the importance of this work, and the need to incorporate it into their national planning. Following this, in 2015 RMS was invited by GNS Science to present the research. Just one year later in 2016, the Kaikoura earthquake was one of the most complex events in recorded history, rupturing multiple faults that propagated over 180 kilometers towards the capital, Wellington.
Tens of Thousands of Landslides
If the CES is remembered for its liquefaction, then Kaikoura is remembered for its landslides. Kaikoura’s large event footprint, and widespread ground shaking resulted in tens of thousands of landslides along the coastline. When looking back through images from the event, the overriding scenes show large-scale landslides cutting through roads and railway lines. Kaikoura highlighted the importance of capturing this destructive risk.
The landslides also incited the insurance market’s concern about localized land failure in key exposure areas such as Wellington, where most homes are built on hillsides. At a macro level, the slopes in Wellington are considered to be relatively stable, however, the concern in Wellington is on a smaller scale due to “cut and fill” earthworks. Not only is there the potential for localized land failures due to ground shaking, but also structurally - these properties are more vulnerable to damage compared to those constructed on flat ground. In addition, they are also more costly to repair. These factors highlight the need to explicitly capture when exposure is built on slopes, in order to account for the potential increased losses in the event of an earthquake.
Another key insight that arose in Wellington from the Kaikoura earthquake was the magnified vulnerability of buildings with hollow-core, or pre-cast floor systems. These are intangible features, and from the outside, these structures only looked to have experienced relatively minor damage. However, structurally and economically, damage to these floors resulted in the subsequent demolition of many mid-rise buildings in Wellington’s central business district. Therefore, it is necessary to explicitly capture the presence, or absence of these features as it makes a significant difference to modeled losses.
As well as informing scientific and engineering advances, the events of the last decade have triggered fundamental changes to local insurance practices. Following the CES, there has been a move in the local insurance market away from open-ended replacement policies to a method of quantifying risk that was new to the local market; sums insured policies and risk-based pricing. As a result, the local insurance practices today are very different to those 10 years ago. The events also supported the Reserve Bank of New Zealand’s update to regulatory reporting requirements from 200- to 1,000-years; one of the highest return periods globally. This shift emphasized the importance of considering the impacts of severe tail events.
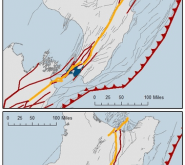
There are two factors that have remained unchanged in New Zealand over the last decade: the country’s location on a major plate boundary, and thanks to the state-backed Earthquake Commission (EQC), it still remains one of the most highly insured countries in the world. The EQC has one of the largest reinsurance placements globally. But despite this, it was clear that before these events, few have truly understood their risk, exposing (re)insurers to considerable losses, as demonstrated by the CES and Kaikoura.
All the extensive data from recent events, and collaboration with local experts, scientific agencies, and (re)insurers has not only advanced our modeling of New Zealand earthquake risk, but have also informed the wider global earthquake development across RMS. The RMS® New Zealand Earthquake high-definition (HD) Model was the first earthquake model to take advantage of our HD modeling framework and has pioneered advanced methodologies. This HD model will be available on RMS Risk Intelligence™, an open-standard platform which delivers unified modeling to manage exposures across the RMS model peril suite. Having a single platform to run models such as the New Zealand Earthquake HD model side-by-side with other models in a seamless workflow enables the global (re)insurance market to make more informed risk management decisions.
Register for the Exceedance 2020 Virtual Event (May 4-7) and attend a dedicated session to discover more about the RMS New Zealand Earthquake HD Model on Risk Intelligence:
Focus on Earthquakes: Japan and New Zealand on Risk Intelligence
Presenters: Laura Barksby, Chesley Williams
Monday, May 4, 10 p.m. – 10.30 p.m. Eastern Daylight Time (EDT)
Wednesday, May 6, 8 a.m. – 8.30 a.m. Eastern Daylight Time (EDT)
Click here to find out more about Exceedance 2020.
Nine Years After Darfield: When an Earthquake Drives a New Model – Part One
…
Read More
Laura Barksby
Assistant Director - Product Manager, Moody's RMS
Laura joined Moody's RMS in 2014 and is an Assistant Director - Product Manager within the global earthquake product management team, based in London. She is responsible for the Moody's RMS New Zealand Earthquake HD Model, as well as the Australia earthquake, and Europe earthquake models.
Laura is a Certified Catastrophe Risk Analyst and holds a bachelor’s degree in Geography, and a master’s degree in Risk and Environmental Hazard both from Durham University.