Preparing for a 1-in-1,000 Year Loss: Insurance Resilience 10 Years After the Christchurch Earthquake
Laura BarksbyFebruary 21, 2021
Not many countries have experienced a catastrophe that directly hit one of their largest cities, but for New Zealand, on February 22, 2011, an M6.2 earthquake struck less than 6 miles (10 kilometers) from the Christchurch central business district. The event generated significant ground motions and unprecedented and widespread liquefaction. Furthermore, it was the most destructive event of the Canterbury Earthquake Sequence (CES), a series of earthquakes across the region that started with the M7.1 Darfield Earthquake on September 4, 2010, and continued through 2011.
As of today, the CES is the world’s second-costliest insured earthquake loss in history and supports the New Zealand regulator’s 1-in-1,000-year capital requirement. Let that sink in. After 2011’s enormous M9 Tohoku Earthquake and Tsunami in Japan, the world’s next-largest earthquake insurance loss occurred in New Zealand – from a series of events with relatively moderate magnitudes, in a country with a population of around five million, and in a city with around 500,000 residents.
The considerable insurance losses arising from the CES resulted from both the significant damage in Christchurch, particularly the February 2011 earthquake, and the high insurance penetration in New Zealand. The latter is largely thanks to a partnership between the insurance industry and the country’s Earthquake Commission (EQC), which provides insurance for over 95 percent of residential properties. As such, three of the world’s top six reinsurance programs cover New Zealand.
The CES was a test for the insurance market, and a small number of more regional and specialized insurers did become insolvent. This reiterated the need for insurers to have adequate financial reserves in the event of a significant earthquake. To reinforce this, in September 2016, the Reserve Bank of New Zealand’s (RBNZ) capital charge was calibrated to a 1-in-1,000-year loss – one of the longest regulatory return periods globally.
If the CES Occurred Today
Let’s consider a repeat of the CES today on a nationwide portfolio – how often could you expect to experience such a loss? On today’s exposure, a modeled loss equivalent to the February 2011 Christchurch Earthquake could be anticipated on average every few hundred years. So, clearly, while the Christchurch event was significant, its loss today would be much lower than the RBNZ’s capital requirement. Even if the losses from the three most damaging earthquakes in the CES were combined, the overall loss today still does not equate to a 1-in-1,000-year event.
Clearly, while the CES was very damaging, in most cases the losses did not reach such high return periods. What if, as an insurer, you are required to have enough capital reserved for something even more devastating? Naturally, this prompts the following questions: What could a 1-in-1,000-year loss look like in New Zealand? How do you manage risk to such a return period? These are questions that the insurance industry in New Zealand is having to consider.
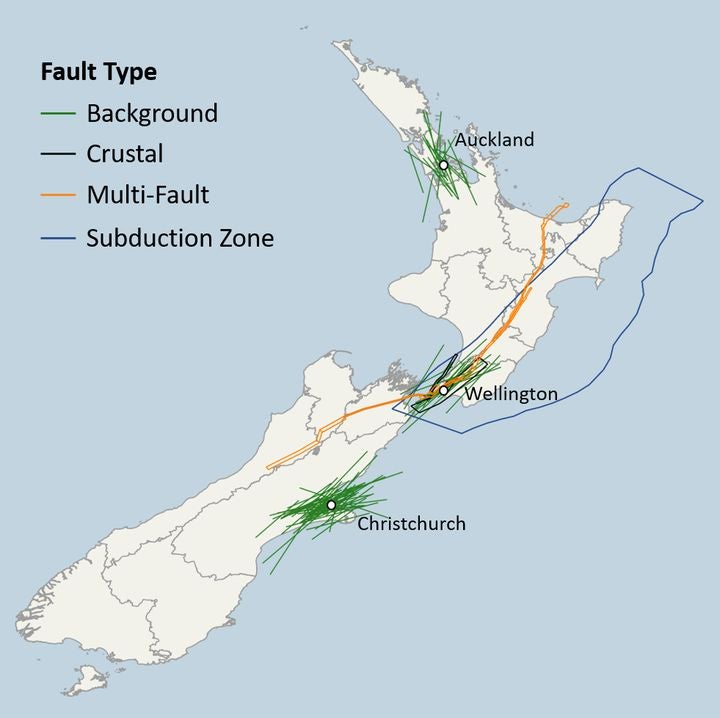
In Christchurch, for an earthquake to trigger the regulatory return period, the event would need to be much more severe than in February 2011. Looking to North Island, strong events under Auckland and Wellington could exceed the 1-in-1,000-year return period. Potential events in Wellington include an M7.7 event on the Wellington Fault that runs directly under the city, as well as an M8.4 event on the nearby Wairarapa Fault. The last significant event on the Wairarapa Fault was in 1855; while the return period for this earthquake is very long, a repeat of this event is considered by insurers to be a worst-case scenario.
Looking further afield, there are other faults capable of generating solvency-testing events. A full rupture of the Hikurangi Subduction Zone, to the east of North Island, could generate up to an M9.2 earthquake. Sophisticated modeling of this fault enables the risk in Wellington to be captured, which, despite its distance from parts of the subduction zone, could experience severe damage in such an event.
Other capital-triggering earthquakes include complex, multi-fault ruptures. These events rupture multiple faults together, often resulting in larger event footprints, and spreading damage over a wider area. Examples include earthquakes that rupture over hundreds of kilometers, crossing both North and South Islands as well through Wellington. Such earthquakes not only have the potential to cause severe damage, but they also increase the likelihood of geographical loss correlations. The RMS® New Zealand Earthquake HD Model is the first in the industry to explicitly model these complex ruptures.
Figure 1: Map illustrating fault types in New Zealand
The CES losses were equivalent to approximately 20 percent of New Zealand’s GDP. Imagine what this percentage could be from a 1-in-1,000-year event. Not only would these events have a significant economic impact, but they would have considerable social consequences. In addition, post-event loss amplification would be notable as restoration times would increase, communities would have to relocate, lifelines and communication services would be affected, infrastructure networks would go down – and the list goes on.
Continued Resilience After the CES
Of course, the likelihood of these events occurring is very low. In the past 10 years, we have seen notable seismicity across New Zealand, but prior to the 2011 Christchurch Earthquake the last major loss was the 1931 Hawkes Bay event.
The Christchurch Earthquake certainly tested the insurance market, but there was a determination to ensure continued resilience. Following the CES, RMS collaborated with the insurance market as well as the scientific and engineering communities to develop the New Zealand Earthquake HD Model. Our involvement continues today with participation in the next update to the national seismic hazard map.
Vivid memories of February 22, 2011 do remain. But – over the last 10 years and moving into the future – New Zealand’s combination of high insurance penetration, comprehensive regulation, and sophisticated modeling all help insurers to understand and manage the challenge posed by seismic risk.
Should New Zealand Be Content with the New EQC Coverages and Caps?
The revised earthquake coverages and caps proposed by the New Zealand Earthquake Commission (EQC) came into law as planned on July 1, 2019. As noted in an RMS blog back in February, these well signaled changes – to increase the building coverage from NZ$100,000 to NZ$150,000 and remove the NZ$20,000 contents cover, only had a small effect on the gross average annual loss for both EQC and the private market. Swapping the first layer of contents exposure for a larger, higher layer of building exposure produced a result that was close to neutral.
Examining the Exceedance Probability (EP) curve (see figure 1 below), the changes are small across all return periods. There are small increases in loss for the private market at short return periods (which produce the small increase in average annual loss reported earlier) but very little change at long return periods.
Critically, the modeled gross 1000-year loss to the private market is essentially unchanged, meaning there are no implications with regards to the Reserve Bank of New Zealand (RBNZ) solvency requirements. Further, these EQC coverage changes are not expected to affect the peril balance driving trans-Tasman solvency considerations where both the RBNZ and Australian Prudential Regulation Authority (APRA) standards must be met.
So, is that the end of the story? Our model results are based on the RMS Industry Exposure Database (IED) so our conclusions rely on the data and assumptions used to estimate the total insured exposure in New Zealand. As we always say in RMS model guidance, our industry results should be used as a guide, but do not expect every individual portfolio to behave the same way. Whether or not swapping contents cover for an extra layer of buildings cover delivers a neutral result will be sensitive to the values and limits assigned to each coverage. So, how confident are we in our exposure estimates?
An RMS IED is developed from the bottom-up, i.e. from building counts, floor areas and construction costs and then validated against local, regional and national macro-economic and demographic benchmarks. For buildings, there is a lot of information to work with, so we have high confidence in our estimated economic and insured building exposure. There is less information for other coverages, so we estimate those as ratios of the overall building exposure. The ratios for New Zealand are consistent with other similar markets around the world. Importantly in our IED, the contents replacement values are estimated, and we then assume the sums insured (the limits) are the same as the replacement values.
There is an accompanying client reference guide available via RMS Owl that provides more details on our New Zealand IED methodology.
Why do we need to estimate contents values? It is true, unlike residential buildings policies, contents policies have always had a specified sum insured. Those sums insured are the limits but how reliable are those figures as estimates of the replacement values? How much underinsurance is there and how has that been coded when models have been run?
The recent changes to EQC are the third time since the Canterbury Earthquake Sequence (CES) in 2010/2011 that exposure values have been put under the spotlight. Immediately after the CES, underinsurance of commercial buildings combined with a lack of average in claims handling drove decisions to rebuild rather than repair. It is imperative model users recognize underinsurance when entering exposure into models or they will obtain unconservative results.
The change from open-ended replacement policies for residential buildings to those based on sums insured was imposed on the New Zealand market by the global reinsurers in the years after the CES. This change forced insurers and homeowners to estimate actual replacement values. This is a deceptively difficult task for an individual building. There is no doubt that online calculators can be extremely useful tools – so long as it is understood that their precision is not to be mistaken for accuracy. Model users would be well advised to run sensitivity tests for underinsurance by scaling the specified sums insured to estimate replacement values lest they repeat the expensive lessons learned from commercial claims in Christchurch.
Now, the removal of contents cover by the EQC is forcing the market to focus on estimating residential contents replacement values. While contents values are lower than building values, they are harder to estimate. It is logical the contents value should increase with the building value across a portfolio, but dwelling by dwelling, what is the contents value? How much does it cost to replace the fridge, the dining table, the food in the cupboard, all the children’s shoes and so on? It adds up – and faster than most homeowners realize.
The public is both apathetic when in comes to investing time to take stock of their possessions and lightning fast with criticism on social media. Consequently, it may take many years until the industry accurately quantifies underinsurance for residential contents. Right now, though, individual insurers can test the sensitivity of their risk to this underinsurance by running different assumptions through the model. In this way they can put some bounds on the new contents risk they have received from the new EQC arrangements. Data quality is improving but no one should be content to stop improving now. The New Zealand market has seen a lot of changes since the CES in 2010/2011 and it is likely there are more changes to come.
Laura joined Moody's RMS in 2014 and is an Assistant Director - Product Manager within the global earthquake product management team, based in London. She is responsible for the Moody's RMS New Zealand Earthquake HD Model, as well as the Australia earthquake, and Europe earthquake models.
Laura is a Certified Catastrophe Risk Analyst and holds a bachelor’s degree in Geography, and a master’s degree in Risk and Environmental Hazard both from Durham University.