Understanding the Aftershock Cloud: 10 Years on Since the Christchurch Earthquakes
Robert Muir-WoodFebruary 21, 2021
Since the year 2000, only one city located in an advanced market economy has been severely impacted by an earthquake. This was the Mw6.2 event that occurred on February 22, 2011, in Christchurch, the capital of South Island, New Zealand, with an epicenter at Port Hills on the southern edge of the city.
This event was part of the 2010–11 Canterbury Earthquake Sequence, which started with the Mw7.1 Darfield Earthquake on September 4, 2010. The Christchurch event followed the Darfield quake some five-and-a-half months later but was an unusually strong aftershock; Christchurch was just 0.9 moment magnitude units less than Darfield.
Now, 10 years on from Christchurch, what lessons are to be learned from the 2010–11 experience – especially with regard to the impact of aftershock events, with potential application to other cities around the globe? What did RMS® learn from Christchurch, and how has this been applied to our modeling?
Aftershocks and Omori’s Law
Japanese seismologist Fusakichi Omori studied aftershocks at the end of the nineteenth century. Omori identified how, following an earthquake, there is a crowd of smaller shocks in the vicinity of the original fault rupture that manifests exponential decay of activity through time, in what is now known as “Omori’s Law.” For a major earthquake such as Darfield, this activity can continue for months.
Aftershock physics explains that the mainshock fault rupture perturbs the stress field over the surrounding volume of rock, within which many smaller fault adjustments then take place. This delayed response is attributed to slow “stress corrosion” associated with the mechanical or chemical weakening of rock barriers, which then allow a fault to slip, generating an aftershock.
Defining an Aftershock
Aftershocks occur in a volume of radius one to two rupture lengths from the original mainshock, and they may be aligned and concentrated around one or both ends of the original fault rupture. While there is exponential decay in numbers of events, there is no exponential decay in magnitude. The largest aftershock can occur months after the mainshock, as seen with the Christchurch event.
The population of aftershocks reflects a frequency distribution that is richer in smaller shocks, with a lower magnitude-frequency gradient (popularly known as the “Gutenberg-Richter b-value”) than the total population of seismicity in that region. Aftershocks are said to have dissipated once activity has returned to background levels.
However, there’s no way to actually point to a specific earthquake and have total confidence that it is a true aftershock – that is, an event triggered by the mainshock that would not otherwise have occurred at the time. Preexisting background seismicity has been supplemented by the triggered seismicity. As the exponential decay proceeds, an increasing proportion of the seismicity would have happened anyway.
Also, perhaps one should consider typical and atypical aftershock behavior. If the activity passes into an area already primed for fault rupture, earthquakes may be more energetic than typical aftershock sequences. So, what can be considered typical?
Båth’s Law
In the 1960s, Swedish seismologist Markus Båth (pronounced “Bort”) declared what is now known as “Båth’s Law”: The largest aftershock is typically 1.1 to 1.2 magnitude units smaller than the mainshock, irrespective of the mainshock size. The Richter magnitude scale is logarithmic, and one magnitude unit step reflects a thirtyfold increase in energy release. Therefore, the largest aftershock typically has about one-fortieth the energy release of the mainshock.
Båth’s Law is a rule of thumb and not a prescription. However, when the largest aftershock is bigger than Båth’s formula, or accompanies several larger-magnitude earthquakes, it moves out of pure aftershock territory into what would be considered “triggered mainshocks.” In 1931, for example, 10 days after an Mw7.8 earthquake in Hawkes Bay, New Zealand, there was a second major earthquake only 0.6 magnitude units smaller.
We can even have the semantic confusion of a succeeding earthquake occurring that is bigger than the original “mainshock,” which then requires renaming the original “mainshock” a “foreshock.”
In developing an earthquake hazard model, typical aftershock sequences are not included in the modeling. The argument goes, if the amplitude of ground motions from the mainshock was enveloped around the original mainshock fault rupture, then aftershocks, by their location and severity, will not exceed this local ground motion threshold.
Including aftershocks would require modeling of tens or even hundreds of additional events for each mainshock, the very large majority of which would be inconsequential or repeat damage already modeled for the mainshock. Furthermore, any contribution of damage from the larger aftershocks may be impossible to isolate, so vulnerability functions based on claims data will already be supplemented by damage from aftershocks.
However, looking at Christchurch, what if we encounter a situation when the aftershocks are larger or more distant from the mainshock than is typical? Suppose we amplify the distinction by placing the mainshock in a rural area and the largest aftershock at shallow depth under a neighboring city?
Examining Christchurch
Looking at the Canterbury Earthquake Sequence of 2010–11, the first and largest event, the Mw7.1 Darfield Earthquake on September 4, 2010, had an epicenter 27 miles (44 kilometers) to the west of Christchurch, on a previously unidentified strike-slip fault-rupture that approached to within 12 miles (20 kilometers) of the city.
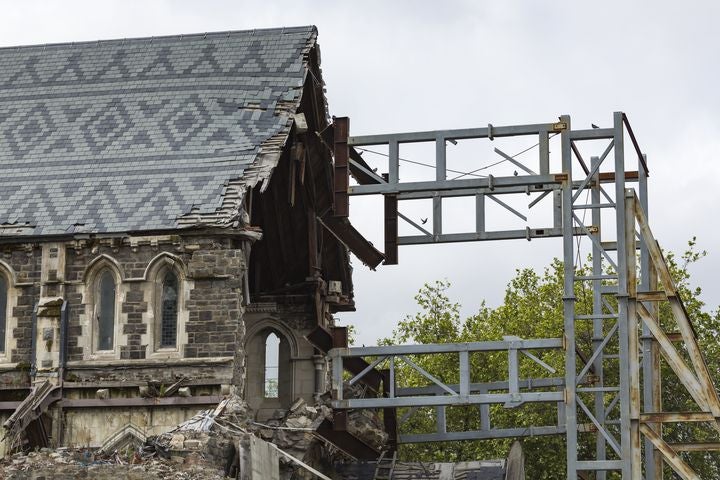
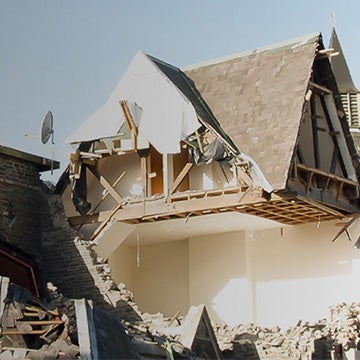
ChristChurch Cathedral was severely damaged by the Christchurch 2011 earthquake
This fault fired off an easterly progressing chatter of earthquakes, more energetic than a typical aftershock sequence. The largest of these, the Christchurch event with a moment magnitude of 6.2 (i.e., only 0.9 magnitude units smaller than the mainshock), occurred in the middle of the day on February 22, 2011, at a shallow depth beneath the southeastern side of the city.
In any random location across the Canterbury Plains, such a shallow event would have limited its impacts to damaging a few farmsteads. In Christchurch’s central business district, however, ground accelerations were three to four times higher than at the same location in the original September mainshock. This largest aftershock contributed the majority of the damage in the city and all the 185 fatalities.
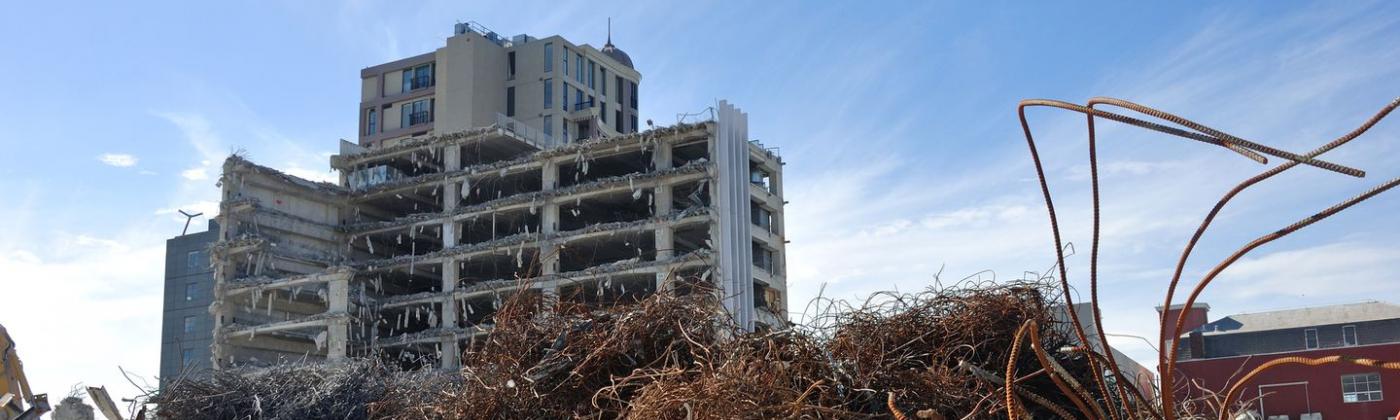
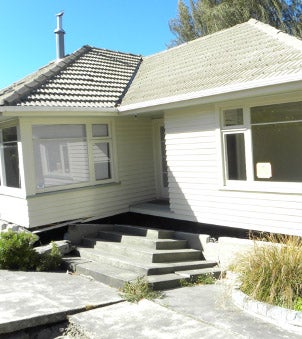
The cost of damage from this, the largest aftershock, was more than four times the original mainshock, and it included the spectacular ultra-liquefaction on the east side of the city, which required relocating 6,000 households. In response to liquefaction and shaking damage, a total of 1,240 buildings had to be demolished across central Christchurch.
Beyond February 2011, significant earthquakes continued in the vicinity of the city. There were two further Mw6.0 events in June and December 2011, and a total of 11 earthquakes over Mw5.0. Several were large enough and close enough to cause further damage and insurance claims, while inciting alarm and uncertainty among all those citizens and agencies tasked with leading the reconstruction.
Whether measured by the largest magnitude or the number of damaging earthquakes, the sequence of earthquakes triggered by the mainshock was more energetic than a standard aftershock sequence. By 2013, this easterly migrating chatter of earthquakes had petered out offshore, to the east of the city.
If the sequence of earthquakes that followed 2010’s Darfield event had been considered a standard aftershock sequence, then the earthquake catalog would have been cleaned of all events except the mainshock. However, analysis of the sequence showed that what happened was more energetic than standard aftershocks. So, the sequence of the largest events was preserved in the catalog and therefore informs seismicity rates in the model, as well as seismic sources for future hazard around Christchurch.
The RMS model is the only New Zealand catastrophe model based on five-year samples of earthquake activity. Within these samples there are numerous earthquake sequences and many, like 2010–11, spanning more than one calendar year.
An aftershock that causes far more damage than the mainshock is extremely unusual. In fact, it is hard to find another example. This is only possible if the mainshock is in a low-population area, and the largest aftershock is a direct hit on a major city.
The Mw7.3 Landers Earthquake in California on June 28, 1992, mostly hit the Mojave Desert. Then, just three-and-a-half hours later, the Mw6.5 Big Bear Earthquake hit a lake resort some 22 miles (35 kilometers) east of the Landers event but still caused less overall damage.[1]The urban area of Christchurch is 114 square miles (295 square kilometers). The surrounding rural Canterbury Plains extend over 17,182 square miles (44,500 square kilometers). The random chance of a “Canterbury Earthquake” hitting the city is around 1 in 150.
For the future, aftershock activity is the one area of earthquake forecasting that shows promise. If activity like the Canterbury Earthquake Sequence had occurred in 2025, one could imagine rapidly simulating multiple representations of potential aftershocks immediately following the September 4, 2010, Mw7.1 Darfield Earthquake mainshock. Even then the shallow Mw6.2 Christchurch event would have been hiding deep in the tail of the aftershock loss exceedance probability (EP). The event was conceivable but still highly unlikely.
A “downward counterfactual” analysis is one where small changes could have exaggerated the impact. For the size, location, and depth of the February 22, 2011, Christchurch Earthquake, a worse outcome would be hard to find. But just because an event has happened does not make it likely. The lesson, both in developing the RMS New Zealand Earthquake HD Model and in exploring the loss EP outputs for other cities worldwide, is to include the worst cases, even while recognizing such outcomes are of low probability.
Robert Muir-Wood works to enhance approaches to natural catastrophe modeling, identify models for new areas of risk, and explore expanded applications for catastrophe modeling. Robert has more than 25 years of experience developing probabilistic catastrophe models. He was lead author for the 2007 IPCC Fourth Assessment Report and 2011 IPCC Special Report on Extremes, and is Chair of the OECD panel on the Financial Consequences of Large Scale Catastrophes.
He is the author of seven books, most recently: ‘The Cure for Catastrophe: How we can Stop Manufacturing Natural Disasters’. He has also written numerous research papers and articles in scientific and industry publications as well as frequent blogs. He holds a degree in natural sciences and a PhD both from Cambridge University and is a Visiting Professor at the Institute for Risk and Disaster Reduction at University College London.