


EXPOSURE
The RMS Magazine with a unique perspective and clear mission “... to provide insight and analysis to help insurance and risk professionals innovate, adapt, and deliver.”

Insurance: The next 10 years
Mohsen Rahnama, Cihan Biyikoglu and Moe Khosravy of RMS look to 2029, consider the…
Times Square, New York City
Author: ANTONY IRELAND
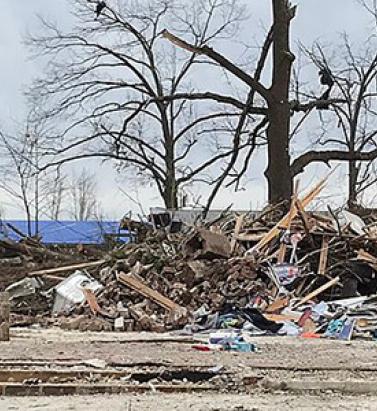
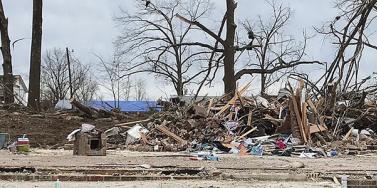
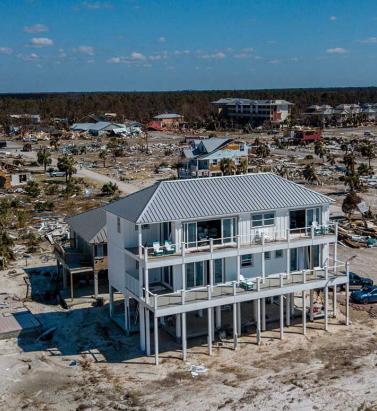
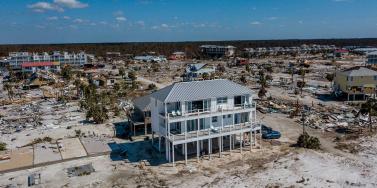
Severe Convective Storms: Experience Cannot Tell the Whole Story
May 05, 2020Severe convective storms can strike with little warning across vast areas of the planet, yet some insurers still rely solely on historical records that do not capture the full spectrum of risk at given locations. EXPOSURE explores the limitations of this approach and how they can be overcome with cat modeling Attritional and high-severity claims from severe convective storms (SCS) — tornadoes, hail, straight-line winds and lightning — are on the rise. In fact, in the U.S., average annual insured losses (AAL) from SCS now rival even those from hurricanes, at around US$17 billion, according to the latest RMS U.S. SCS Industry Loss Curve from 2018. In Canada, SCS cost insurers more than any other natural peril on average each year. Despite the scale of the threat, it is often overlooked as a low volatility, attritional peril Christopher Allen RMS “Despite the scale of the threat, it is often overlooked as a low volatility, attritional peril,” says Christopher Allen, product manager for the North American SCS and winterstorm models at RMS. But losses can be very volatile, particularly when considering individual geographic regions or portfolios (see Figure 1). Moreover, they can be very high. “The U.S. experiences higher insured losses from SCS than any other country. According to the National Weather Service Storm Prediction Center, there over 1,000 tornadoes every year on average. But while a powerful tornado does not cause the same total damage as a major earthquake or hurricane, these events are still capable of causing catastrophic losses that run into the billions.” Figure 1: Insured losses from U.S. SCS in the Northeast (New York, Connecticut, Rhode Island, Massachusetts, New Hampshire, Vermont, Maine), Great Plains (North Dakota, South Dakota, Nebraska, Kansas, Oklahoma) and Southeast (Alabama, Mississippi, Louisiana, Georgia). Losses are trended to 2020 and then scaled separately for each region so the mean loss in each region becomes 100. Source: Industry Loss Data Two of the costliest SCS outbreaks to date hit the U.S. in spring 2011. In late April, large hail, straight-line winds and over 350 tornadoes spawned across wide areas of the South and Midwest, including over the cities of Tuscaloosa and Birmingham, Alabama, which were hit by a tornado rating EF-4 on the Enhanced Fujita (EF) scale. In late May, an outbreak of several hundred more tornadoes occurred over a similarly wide area, including an EF-5 tornado in Joplin, Missouri, that killed over 150 people. If the two outbreaks occurred again today, according to an RMS estimate based on trending industry loss data, each would easily cause over US$10 billion of insured loss. However, extreme losses from SCS do not just occur in the U.S. In April 1999, a hailstorm in Sydney dropped hailstones of up to 3.5 inches (9 centimeters) in diameter over the city, causing insured losses of AU$5.6 billion according to the Insurance Council of Australia (ICA), currently the most costly insurance event in Australia’s history [1]. “It is entirely possible we will soon see claims in excess of US$10 billion from a single SCS event,” Allen says, warning that relying on historical data alone to quantify SCS (re)insurance risk leaves carriers underprepared and overexposed. Historical Records are Short and Biased According to Allen, the rarity of SCS at a local level means historical weather and loss data fall short of fully characterizing SCS hazard. In the U.S., the Storm Prediction Center’s national record of hail and straight-line wind reports goes back to 1955, and tornado reports date back to 1950. In Canada, routine tornado reports go back to 1980. “These may seem like adequate records, but they only scratch the surface of the many SCS scenarios nature can throw at us,” Allen says. “To capture full SCS variability at a given location, records should be simulated over thousands, not tens, of years,” he explains. “This is only possible using a cat model that simulates a very wide range of possible storms to give a fuller representation of the risk at that location. Observed over tens of thousands of years, most locations would have been hit by SCS just as frequently as their neighbors, but this will never be reflected in the historical records. Just because a town or city has not been hit by a tornado in recent years doesn’t mean it can’t be.” To capture full SCS variability at a given location, records should be simulated over thousands, not tens, of years Shorter historical records could also misrepresent the severity of SCS possible at a given location. Total insured catastrophe losses in Phoenix, Arizona, for example, were typically negligible between 1990 and 2009, but on October 5, 2010, Phoenix was hit by its largest-ever tornado and hail outbreak, causing economic losses of US$4.5 billion. (Source: NOAA National Centers for Environmental Information) Just like the national observations, insurers’ own claims histories, or industry data such as presented in Figure 1, are also too short to capture the full extent of SCS volatility, Allen warns. “Some primary insurers write very large volumes of natural catastrophe business and have comprehensive claims records dating back 20 or so years, which are sometimes seen as good enough datasets on which to evaluate the risk at their insured locations. However, underwriting based solely on this length of experience could lead to more surprises and greater earnings instability.” If a Tree Falls and No One Hears… Historical SCS records in most countries rely primarily on human observation reports. If a tornado is not seen, it is not reported, which means that unlike a hurricane or large earthquake it is possible to miss SCS in the recent historical record. “While this happens less often in Europe, which has a high population density, missed sightings can distort historical data in Canada, Australia and remote parts of the U.S.,” Allen explains. Another key issue is that the EF scale rates tornado strength based on how much damage is caused, but this does not always reflect the power of the storm. If a strong tornado occurs in a rural area with few buildings, for example, it won’t register high on the EF scale, even though it could have caused major damage to an urban area. “This again makes the historical record very challenging to interpret,” he says. “Catastrophe modelers invest a great deal of time and effort in understanding the strengths and weaknesses of historical data. By using robust aspects of observations in conjunction with other methods, for example numerical weather simulations, they are able to build upon and advance beyond what experience tells us, allowing for more credible evaluation of SCS risk than using experience alone.” Then there is the issue of rising exposures. Urban expansion and rising property prices, in combination with factors such as rising labor costs and aging roofs that are increasingly susceptible to damage, are pushing exposure values upward. “This means that an identical SCS in the same location would most likely result in a higher loss today than 20 years ago, or in some cases may result in an insured loss where previously there would have been none,” Allen explains. Calgary, Alberta, for example, is the hailstorm capital of Canada. On September 7, 1991, a major hailstorm over the city resulted in the country’s largest insured loss to date from a single storm: CA$343 million was paid out at the time. The city has of course expanded significantly since then (see Figure 2), and the value of the exposure in preexisting urban areas has also increased. An identical hailstorm occurring over the city today would therefore cause far larger insured losses, even without considering inflation. Figure 2: Urban expansion in Calgary, Alberta, Canada. European Space Agency. Land Cover CCI Product User Guide Version 2. Tech. Rep. (2017). Available at: maps.elie.ucl.ac.be/CCI/viewer/download/ESACCI-LC-Ph2-PUGv2_2.0.pdf “Probabilistic SCS cat modeling addresses these issues,” Allen says. “Rather than being constrained by historical data, the framework builds upon and beyond it using meteorological, engineering and insurance knowledge to evaluate what is physically possible today. This means claims do not have to be ‘on-leveled’ to account for changing exposures, which may require the user to make some possibly tenuous adjustments and extrapolations; users simply input the exposures they have today and the model outputs today’s risk.” The Catastrophe Modeling Approach In addition to their ability to simulate “synthetic” loss events over thousands of years, Allen argues, cat models make it easier to conduct sensitivity testing by location, varying policy terms or construction classes; to drill into loss-driving properties within portfolios; and to optimize attachment points for reinsurance programs. SCS cat models are commonly used in the reinsurance market, partly because they make it easy to assess tail risk (again, difficult to do using a short historical record alone), but they are currently used less frequently for underwriting primary risks. There are instances of carriers that use catastrophe models for reinsurance business but still rely on historical claims data for direct insurance business. So why do some primary insurers not take advantage of the cat modeling approach? “Though not marketwide, there can be a perception that experience alone represents the full spectrum of SCS risk — and this overlooks the historical record’s limitations, potentially adding unaccounted-for risk to their portfolios,” Allen says. What is more, detailed studies of historical records and claims “on-leveling” to account for changes over time are challenging and very time-consuming. By contrast, insurers who are already familiar with the cat modeling framework (for example, for hurricane) should find that switching to a probabilistic SCS model is relatively simple and requires little additional learning from the user, as the model employs the same framework as for other peril models, he explains. A US$10 billion SCS loss is around the corner, and carriers need to be prepared and have at their disposal the ability to calculate the probability of that occurring for any given location Furthermore, catastrophe model data formats, such as the RMS Exposure and Results Data Modules (EDM and RDM), are already widely exchanged, and now the Risk Data Open Standard™ (RDOS) will have increasing value within the (re)insurance industry. Reinsurance brokers make heavy use of cat modeling submissions when placing reinsurance, for example, while rating agencies increasingly request catastrophe modeling results when determining company credit ratings. Allen argues that with property cat portfolios under pressure and the insurance market now hardening, it is all the more important that insurers select and price risks as accurately as possible to ensure they increase profits and reduce their combined ratios. “A US$10 billion SCS loss is around the corner, and carriers need to be prepared and have at their disposal the ability to calculate the probability of that occurring for any given location,” he says. “To truly understand their exposure, risk must be determined based on all possible tomorrows, in addition to what has happened in the past.” [1] Losses normalized to 2017 Australian dollars and exposure by the ICA. Source: https://www.icadataglobe.com/access-catastrophe-data. To obtain a holistic view of severe weather risk contact the RMS team here


The Art of Empowerment
May 20, 2019A new app – SiteIQ™ from RMS intuitively synthesizes complex risk data for a single location, helping underwriters and coverholders to rate and select risks at the touch of a button The more holistic view of risk a property underwriter can get, the better decisions they are likely to make. In order to build up a detailed picture of risk at an individual location, underwriters or agents at coverholders have, until now, had to request exposure analytics on single risks from their portfolio managers and brokers. Also, they had to gather supplementary risk data from a range of external resources, whether it is from Catastrophe Risk Evaluation and Standardizing Target Accumulations (CRESTA) zones to look-ups on Google Maps. This takes valuable time, requires multiple user licenses and can generate information that is inconsistent with the underlying modeling data at the portfolio level. As the senior manager at one managing general agent (MGA) tells EXPOSURE, this misalignment of data means underwriting decisions are not always being made with confidence. This makes the buildup of unwanted risk aggregation in a particular area a very real possibility, invariably resulting in “senior management breathing down my neck.” With underwriters in desperate need of better multi-peril data at the point of underwriting, RMS has developed an app, SiteIQ, that leverages sophisticated modeling information, as well as a view of the portfolio of locations underwritten, to be easily understood and quickly actionable at the point of underwriting. But it also goes further as SiteIQ can integrate with a host of data providers so users can enter any address into the app and quickly see a detailed breakdown of the natural and human-made hazards that may put the property at risk. SiteIQ allows the underwriter to generate detailed risk scores for each location in a matter of seconds In addition to synthesized RMS data, users can also harness third-party risk data to overlay responsive map layers such as, arson, burglary and fire-protection insights, and other indicators that can help the underwriter better understand the characteristics of a building and assess whether it is well maintained or at greater risk. The app allows the underwriter to generate detailed risk scores for each location in a matter of seconds. It also assigns a simple color coding for each hazard, in line with the insurer’s appetite: whether that’s green for acceptable levels of risk all the way to red for risks that require more complex analysis. Crucially, users can view individual locations in the context of the wider portfolio, helping them avoid unwanted risk aggregation and write more consistently to the correct risk appetite. The app goes a level further by allowing clients to use a sophisticated rules engine that takes into account the client’s underwriting rules. This enables SiteIQ to recommend possible next steps for each location — whether that’s to accept the risk, refer it for further investigation or reject it based on breaching certain criteria. “We decided to build an app exclusively for underwriters to help them make quick decisions when assessing risks,” explains Shaheen Razzaq, senior director at RMS. “SiteIQ provides a systematic method to identify locations that don’t meet your risk strategy so you can focus on finding the risks that do. “People are moving toward simple digital tools that synthesize information quickly,” he adds. “Underwriters tell us they want access to science without having to rely on others and the ability to screen and understand risks within seconds.” And as the underlying data behind the application is based on the same RMS modeling information used at the portfolio level, this guarantees data consistency at all points in the chain. “Deep RMS science, including data from all of our high-definition models, is now being delivered to people upstream, building consistency and understanding,” says Razzaq. SiteIQ has made it simple to build in the customer’s risk appetite and their view of risk. “One of the major advantages of the app is that it is completely configurable by the customer. This could be assigning red-amber-green to perils with certain scores, setting rules for when it should recommend rejecting a location, or integrating a customer’s proprietary data that may have been developed using their underwriting and claims experience — which is unique to each company.” Reporting to internal and external stakeholders is also managed by the app. And above all, says Razzaq, it is simple to use, priced at an accessible level and requires no technical skill, allowing underwriters to make quick, informed decisions from their desktops and tablet devices — and soon their smartphones. In complex cases where deeper analysis is required or when models should be run, working together with cat modelers will still be a necessity. But for most risks, underwriters will be able to quickly screen and filter risk factors, reducing the need to consult their portfolio managers or cat modeling teams. “With underwriting assistants a thing of the past, and the expertise the cat modelers offer being a valuable but finite resource, it’s our responsibility to understand risk at the point of underwriting,” one underwriter explains. “As a risk decision-maker, when I need to make an assessment on a particular location, I need access to insights in a timely and efficient manner, so that I can make the best possible decision based on my business,” another underwriter adds. The app is not intended to replace the deep analysis that portfolio management teams do, but instead reduce the number of times they are asked for information by their underwriters, giving them more time to focus on the job at hand — helping underwriters assess the most complex of risks. Bringing Coverholders on Board Similar efficiencies can be gained on cover-holder/delegated-authority business. In the past, there have been issues with cover-holders providing coverage that takes a completely different view of risk to the syndicate or managing agent that is providing the capacity. RMS has ensured SiteIQ works for coverholders, to give them access to shared analytics, managing agent rules and an enhanced view of hazards. It is hoped this will both improve underwriting decision-making by the coverholders and strengthen delegated-authority relationships. Coverholder business continues to grow in the Lloyd’s and company markets, and delegating authorities often worry whether the risks underwritten on their behalf are done so with the best possible information available. A better scenario is when the coverholder contacts the delegating authority to ask for advice on a particular location, but receiving multiple referral calls each day from coverholders seeking decisions on individual risks can be a drain on these growing businesses’ resources. “Delegated authorities obviously want coverholders to write business doing the proper risk assessments, but on the other hand, if the coverholder is constantly pinging the managing agent for referrals, they aren’t a good partner,” says a senior manager at one MGA. “We can increase profitability if we improve our current workflow, and that can only be done with smart tools that make risk management simpler,” he notes, adding that better risk information tools would allow his company to redeploy staff. A recent Lloyd’s survey found that 55 percent of managing agents are struggling with resources in their delegated-authority teams. And with the Lloyd’s Corporation also seeking to cleanse the market of sub-par performers after swinging to a loss in 2018, any solution that drives efficiency and enables coverholders to make more informed decisions can only help drive up standards. “It was actually an idea that stemmed from our clients’ underwriting coverholder business. If we can equip coverholders with these tools, managing agents will receive fewer phone calls while being confident that the coverholder is writing good business in line with the agreed rules,” says Razzaq. “Most coverholders lack the infrastructure, budget and human resources to run complex models. With SiteIQ, RMS can now offer them deeper analytics, by leveraging expansive model science, in a more accessible way and at a more affordable price.”
Underwriting With 20:20 Vision
May 20, 2019Risk data delivered to underwriting platforms via application programming interfaces (API) is bringing granular exposure information and model insights to high-volume risks The insurance industry boasts some of the most sophisticated modeling capabilities in the world. And yet the average property underwriter does not have access to the kind of predictive tools that carriers use at a portfolio level to manage risk aggregation, streamline reinsurance buying and optimize capitalization. Detailed probabilistic models are employed on large and complex corporate and industrial portfolios. But underwriters of high-volume business are usually left to rate risks with only a partial view of the risk characteristics at individual locations, and without the help of models and other tools. “There is still an insufficient amount of data being gathered to enable the accurate assessment and pricing of risks [that] our industry has been covering for decades,” says Talbir Bains, founder and CEO of managing general agent (MGA) platform Volante Global. Access to insights from models used at the portfolio level would help underwriters make decisions faster and more accurately, improving everything from risk screening and selection to technical pricing. However, accessing this intellectual property (IP) has previously been difficult for higher-volume risks, where to be competitive there simply isn’t the time available to liaise with cat modeling teams to configure full model runs and build a sophisticated profile of the risk. Many insurers invest in modeling post-bind in order to understand risk aggregation in their portfolios, but Ross Franklin, senior director of data product management at RMS, suggests this is too late. “From an underwriting standpoint, that’s after the horse has bolted — that insight is needed upfront when you are deciding whether to write and at what price.” By not seeing the full picture, he explains, underwriters are often making decisions with a completely different view of risk from the portfolio managers in their own company. “Right now, there is a disconnect in the analytics used when risks are being underwritten and those used downstream as these same risks move through to the portfolio.” Cut off From the Insight Historically, underwriters have struggled to access complete information that would allow them to better understand the risk characteristics at individual locations. They must manually gather what risk information they can from various public- and private-sector sources. This helps them make broad assessments of catastrophe exposures, such as FEMA flood zone or distance to coast. These solutions often deliver data via web portals or spreadsheets and reports — not into the underwriting systems they use every day. There has been little innovation to increase the breadth, and more importantly, the usability of data at the point of underwriting. “Vulnerability is critical to accurate underwriting. Hazard alone is not enough” Ross Franklin RMS “We have used risk data tools but they are too broad at the hazard level to be competitive — we need more detail,” notes one senior property underwriter, while another simply states: “When it comes to flood, honestly, we’re gambling.” Misaligned and incomplete information prevents accurate risk selection and pricing, leaving the insurer open to negative surprises when underwritten risks make their way onto the balance sheet. Yet very few data providers burrow down into granular detail on individual risks by identifying what material a property is made of, how many stories it is, when it was built and what it is used for, for instance, all of which can make a significant difference to the risk rating of that individual property. “Vulnerability is critical to accurate underwriting. Hazard alone is not enough. When you put building characteristics together with the hazard information, you form a deeper understanding of the vulnerability of a specific property to a particular hazard. For a given location, a five-story building built from reinforced concrete in the 1990s will naturally react very differently in a storm than a two-story wood-framed house built in 1964 — and yet current underwriting approaches often miss this distinction,” says Franklin. In response to demand for change, RMS developed a Location Intelligence application programming interface (API), which allows preformatted RMS risk information to be easily distributed from its cloud platform via the API into any third-party or in-house underwriting software. The technology gives underwriters access to key insights on their desktops, as well as informing fully automated risk screening and pricing algorithms. The API allows underwriters to systematically evaluate the profitability of submissions, triage referrals to cat modeling teams more efficiently and tailor decision-making based on individual property characteristics. It can also be overlaid with third-party risk information. “The emphasis of our latest product development has been to put rigorous cat peril risk analysis in the hands of users at the right points in the underwriting workflow,” says Franklin. “That’s a capability that doesn’t exist today on high-volume personal lines and SME business, for instance.” Historically, underwriters of high-volume business have relied on actuarial analysis to inform technical pricing and risk ratings. “This analysis is not usually backed up by probabilistic modeling of hazard or vulnerability and, for expediency, risks are grouped into broad classes. The result is a loss of risk specificity,” says Franklin. “As the data we are supplying derives from the same models that insurers use for their portfolio modeling, we are offering a fully connected-up, consistent view of risk across their property books, from inception through to reinsurance.” With additional layers of information at their disposal, underwriters can develop a more comprehensive risk profile for individual locations than before. “In the traditional insurance model, the bad risks are subsidized by the good — but that does not have to be the case. We can now use data to get a lot more specific and generate much deeper insights,” says Franklin. And if poor risks are screened out early, insurers can be much more precise when it comes to taking on and pricing new business that fits their risk appetite. Once risks are accepted, there should be much greater clarity on expected costs should a loss occur. The implications for profitability are clear. Harnessing Automation While improved data resolution should drive better loss ratios and underwriting performance, automation can attack the expense ratio by stripping out manual processes, says Franklin. “Insurers want to focus their expensive, scarce underwriting resources on the things they do best — making qualitative expert judgments on more complex risks.” This requires them to shift more decision-making to straight-through processing using sophisticated underwriting guidelines, driven by predictive data insight. Straight-through processing is already commonplace in personal lines and is expected to play a growing role in commercial property lines too. “Technology has a critical role to play in overcoming this data deficiency through greatly enhancing our ability to gather and analyze granular information, and then to feed that insight back into the underwriting process almost instantaneously to support better decision-making,” says Bains. “However, the infrastructure upon which much of the insurance model is built is in some instances decades old and making the fundamental changes required is a challenge.” Many insurers are already in the process of updating legacy IT systems, making it easier for underwriters to leverage information such as past policy information at the point of underwriting. But technology is only part of the solution. The quality and granularity of the data being input is also a critical factor. Are brokers collecting sufficient levels of data to help underwriters assess the risk effectively? That’s where Franklin hopes RMS can make a real difference. “For the cat element of risk, we have far more predictive, higher-quality data than most insurers use right now,” he says. “Insurers can now overlay that with other data they hold to give the underwriter a far more comprehensive view of the risk.” Bains thinks a cultural shift is needed across the entire insurance value chain when it comes to expectations of the quantity, quality and integrity of data. He calls on underwriters to demand more good quality data from their brokers, and for brokers to do the same of assureds. “Technology alone won’t enable that; the shift is reliant upon everyone in the chain recognizing what is required of them.”
