
EXPOSURE
The Moody's insurance solutions magazine with a unique perspective and clear mission “... to provide insight and analysis to help insurance and risk professionals innovate, adapt, and deliver.”
Insurance: The next 10 years
Mohsen Rahnama, Cihan Biyikoglu and Moe Khosravy of RMS look to 2029, consider the…
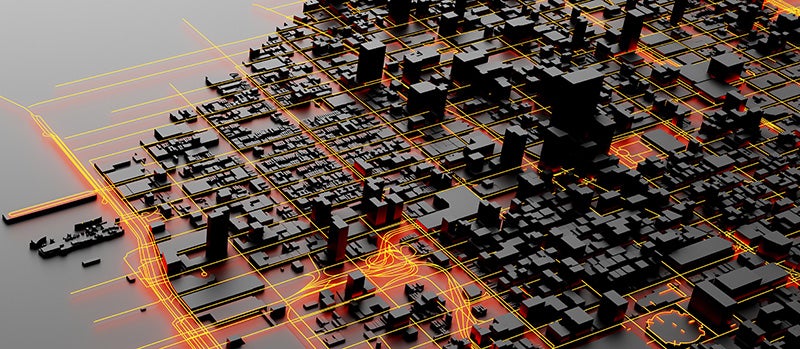
Times Square, New York City
Tag: RMS HWIND

RMS HWind Hurricane Forecasting and Response and ExposureIQ: Exposure Management Without the Grind
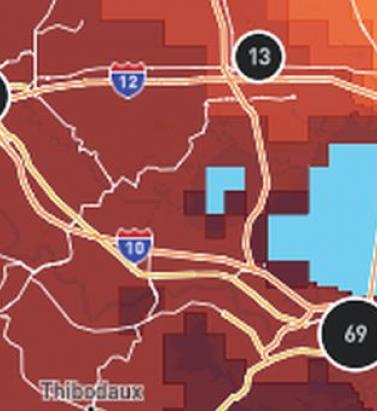
June 19, 2022Accessing data in real-time to assess and manage an insurance carrier’s potential liabilities from a loss event remains the holy grail for exposure management teams and is high on a business’ overall wish list A 2021 PwC Pulse Survey of U.S. risk management leaders found that risk executives are increasingly taking advantage of “tech solutions for real-time and automated processes, including dynamic risk monitoring (30 percent), new risk management tech solutions (25 percent), data analytics (24 percent) [and] integrated risk management tools on a single platform (19 percent)”. PwC suggested that as part of an organization’s wider digital and business transformation process, risk management teams should therefore: “use technologies that work together, draw on common data sources, build enterprise-wide analytics and define common sets of metrics.” Separately, Deloitte’s 2021 third-party risk management (TPRM) survey found that 53 percent of respondents across a range of industry sectors wanted to improve real-time information, risk metrics, and reporting in their organizations. With the pandemic providing the unlikely backdrop for driving innovation across the business world, the Deloitte survey explained the statistic with the suggestion that one impact of COVID-19 “has been a greater need for real-time continuous assessment and alerts, rather than traditional point-in-time third-party assessment.” Event Forecasting and Response with HWind and ExposureIQ Natural catastrophe events are a risk analytics flash point. And while growing board-level awareness of the importance of real-time reporting might seem like a positive, without marrying the data with the right tools to gather and process that data, together with a more integrated approach to risk management and modeling functions, the pain points for exposure managers on the event frontline, are unlikely to be relieved. RMS® ExposureIQ™ is an exposure management application available on the cloud-native RMS Intelligent Risk Platform™, which enables clients to centralize exposure data, process it, write direct reports and then run deterministic scenarios to quickly and accurately assess their exposure. When an event is threatening or impacts risks, an exposure management team needs to rapidly process the available data to work out their overall exposure and the likely effect on insured assets. The integration of event response data such as HWind into the ExposureIQ application is where the acquisition of this hazard data really starts to make a difference. The 2022 North Atlantic hurricane season, for example, is upon us, and access to regular, real-time data is relied upon as a crucial part of event response to tropical cyclones. With reliable event response analytics, updated in real-time, businesses can get fully prepared and ensure solvency through additional reinsurance cover, more accurately reserve funds, and confidently communicate risk to all stakeholders. The National Oceanic and Atmospheric Administration’s (NOAA) National Hurricane Center (NHC) has long been viewed as a valuable resource for forecasts on the expected track and severity of hurricanes. However, according to Callum Higgins, product manager, global climate, at RMS, “There are some limitations with what you get [from the NHC]. Forecasts lack detailed insights into the spatial variability of hazard severity and while uncertainty is accounted for, this is based on historical data rather than the forecast uncertainty specific to the storm. Hurricane Henri in 2021 was a good example of this. While the ultimate landfall location fell outside the NHC ‘cone of uncertainty’ four days in advance of landfall, given the large model uncertainty in the track for Henri, HWind forecasts were able to account for this possibility.” Introducing HWind RMS HWind provides observation-based tropical cyclone data for both real-time and historical events and was originally developed as a data service for the NHC by renowned meteorologist Dr. Mark Powell. It combines the widest set of observations for a particular storm in order to create the most accurate representation of its wind field. Since RMS acquired HWind in 2015, it has continually evolved as a solution that can be leveraged more easily by insurers to benefit individual use cases. HWind provides snapshots (instantaneous views of the storm’s wind field) and cumulative footprints (past swaths of the maximum wind speeds) every six hours. In addition, RMS delivers hurricane forecast data that includes a series of forecast scenarios of both the wind and surge hazard, enabling users to understand the potential severity of the event up to five days in advance of landfall. “Because HWind real-time products are released up to every six hours, you can adapt your response as forecasts shift. After an event has struck you very quickly get a good view of which areas have been impacted and to what level of severity,” explains Higgins. The level of detail is another key differentiator. In contrast to the NHC forecasts, which do not include a detailed wind field, HWind provides much more data granularity, with forecast wind and surge scenarios developed by leveraging the RMS North Atlantic Hurricane Models. Snapshots and cumulative footprints, meanwhile, represent the wind field on a 1x1 kilometer grid. And while the NHC does provide uncertainty metrics in its forecasts, such as the “cone of uncertainty” around where the center of the storm will track, these are typically based on historical statistics. “HWind accounts for the actual level of model convergence for a particular storm. That provides you with the insights you need to make decisions around how much confidence to place in each forecast, including whether a more conservative approach is required in cases of heightened uncertainty,” Higgins explains. HWind’s observational approach and access to more than 30 data sources, some of which are exclusive to RMS, means users are better able to capture a particular wind field and apply that data across a wide variety of use cases. Some HWind clients – most notably, Swiss Re – also use it as a trigger for parametric insurance policies. “That’s a critical component for some of our clients,” says Higgins. “For a parametric trigger, you want to make sure you have as accurate as possible a view of the wind speed experienced at underwritten locations when a hurricane strikes.” Real-time data is only one part of the picture. The HWind Enhanced Archive is a catalog of data – including high-resolution images, snapshots, and footprints from historical hurricanes extending back almost 30 years that can be used to validate historical claims and loss experience. “When we're creating forecasts in real-time, we only have the information of what has come before [in that particular storm],” says Higgins. “With the archive, we can take advantage of the data that comes in after we produce the snapshots and use all of that to produce an enhanced archive to improve what we do in real-time.” Taking the Stress out of Event Response “Event response is quite a stressful time for the insurance industry, because they've got to make business decisions based around what their losses could be,” Higgins adds. “At the time of these live events, there's always increased scrutiny around their exposure and reporting.” HWind has plugged the gap in the market for a tool that can provide earlier, more frequent, and more detailed insights into the potential impact of a hurricane before, during, and following landfall. “The key reason for having HWind available with ExposureIQ is to have it all in one place,” explains Higgins. “There are many different sources of information out there, and during a live event the last thing you want to do is be scrambling across websites trying to see who's released what and then pull it across to your environment, so you can overlay it on your live portfolio of risks. As soon as we release the accumulation footprints, they are uploaded directly into the application, making it faster and more convenient for users to generate an understanding of potential loss for their specific portfolios." RMS applications such as ExposureIQ, and the modeling application Risk Modeler™, all use the same cloud-native Intelligent Risk Platform. This allows for a continuous workflow, allowing users to generate both accumulation analytics as well as modeled losses from the same set of exposure data. During an event, for example, with the seven hurricane scenarios that form part of the HWind data flow, the detailed wind fields and tracks (see Figure below) and the storm surge footprints for each scenario can be viewed on the ExposureIQ application for clients to run accumulations against. The application has a robust integrated mapping service that allows users to view their losses and hot spots on a map, and it also includes the functionality to switch to see the same data distributed in loss tables if that is preferred. “Now that we have both those on view in the cloud, you can overlay the footprint files on top of your exposures, and quickly see it before you even run [the accumulations],” says Higgins. Figure 1: RMS HWind forecast probability of peak gusts greater than 80 miles per hour from Hurricane Ida at 1200UTC August 29, 2021, overlaid on exposure data within the RMS ExposureIQ applicationOne-Stop-Shop This close interaction between HWind and the ExposureIQ application indicates another advantage of the RMS product suite – the use of consistent event response data across the platform so exposure mapping and modeling are all in one place. “The idea is that by having it on the cloud, it is much more performant; you can analyze online portfolios a lot more quickly, and you can get those reports to your board a lot faster than previously,” says Higgins. In contrast to other solutions in the market, which typically use third-party hazard tools and modeling platforms, the RMS suite has a consistent model methodology flowing through the entire product chain. “That's really where the sweet spot of ExposureIQ is – this is all one connected ecosystem,” commented Higgins. “I get my data into ExposureIQ and it is in the same format as Risk Modeler, so I don't need to convert anything. Both products use a consistent financial model too – so you are confident the underlying policy and reinsurance terms are being applied in the same way.” The modular nature of the RMS application ecosystem means that, in addition to hurricane risks, data on perils such as floods, earthquakes, and wildfires are also available – and then processed by the relevant risk modeling tool to give clients insights on their potential losses. “With that indication of where you might expect to experience claims, and how severe those claims might be, you can start to reach out to policyholders to understand if they've been affected.” At this point, clients are then in a good position to start building their claims deployment strategy, preparing claims adjusters to visit impacted sites and briefing reserving and other teams on when to start processing payments. But even before a hurricane has made landfall, clients can make use of forecast wind fields to identify locations that might be affected in advance of the storm and warn policyholders to prepare accordingly. “That can not only help policyholders to protect their property but also mitigate insurance losses as well,” says Higgins. “Similarly, you can use it to apply an underwriting moratorium in advance of a storm. Identify areas that are likely to be impacted, and then feed that into underwriting processes to ensure that no one can write a policy in the region when a storm is approaching.” The First Unified Risk Modeling Platform Previously, before moving to an integrated, cloud-based platform, these tools would likely have been hosted using on-premises servers with all the significant infrastructure costs that implies. Now, in addition to accessing a full suite of products via a single cloud-native platform, RMS clients can also leverage the company’s three decades of modeling expertise, benefiting from a strong foundation of trusted exposure data to help manage their exposures. “A key goal for a lot of people responding to events is initially to understand what locations are affected, how severely they're affected, and what their total exposed limit is, and to inform things like deploying claims adjusters,” says Higgins. And beyond the exposure management function, argues Higgins, it’s about gearing up for the potential pain of those claims, the processes that go around that, and the communication to the board. “These catastrophic events can have a significant impact on a company’s revenue, and the full implications – and any potential mitigation – needs to be well understood.” Find out more about the award-winning ExposureIQ.
In the Eye of the Storm
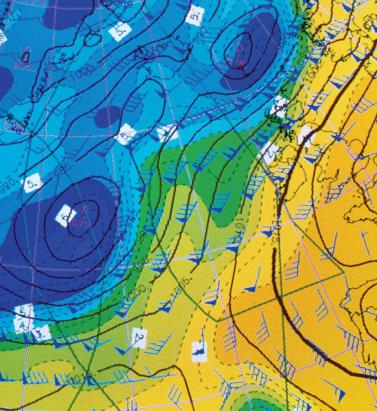
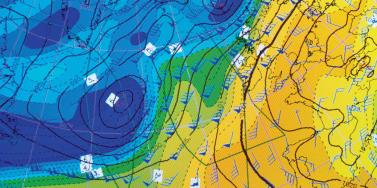
May 10, 2018Advances in data capture are helping to give (re)insurers an unparalleled insight into weather-related activity Weather-related data is now available on a much more localized level than ever before. Rapidly expanding weather station networks are capturing terabytes of data across multiple weather-related variables on an almost real-time basis, creating a “ground-truth” clarity multiple times sharper than that available only a few years ago. In fact, so hyperlocalized has this data become that it is now possible to capture weather information “down to a city street corner in some cases,” according to Earth Networks’ chief meteorologist Mark Hoekzema. “The greater the resolution of the data, the more accurate the damage verification” Mark Hoekzema earth networks This ground-level data is vital to the insurance industry given the potential for significant variations in sustained damage levels from one side of the street to the other during weather-related events, he adds. “Baseball-sized hail can fall on one side of the street while just a block over there might be only pea-sized hail and no damage. Tornados and lightning can decimate a neighborhood and leave a house untouched on the same street. The greater the resolution of the data, the more accurate the damage verification.” High-Resolution Perils This granularity of data is needed to fuel the high-resolution modeling capabilities that have become available over the last five to ten years. “With the continued increase in computational power,” Hoekzema explains, “the ability to run models at very high resolutions has become commonplace. Very high-resolution inputs are needed for these models to get the most out of the computations.” In July 2017, RMS teamed up with Earth Networks, capitalizing on its vast network of stations across North America and the Caribbean and reams of both current and historical data to feed into RMS HWind tropical cyclone wind field data products. “Through our linkup with Earth Networks, RMS has access to data from over 6,000 proprietary weather stations across the Americas and Caribbean, particularly across the U.S.,” explains Jeff Waters, senior product manager of model product management at RMS. “That means we can ingest data on multiple meteorological variables in almost real time: wind speed, wind direction and sea level pressure. “By integrating this ground-level data from Earth Networks into the HWind framework, we can generate a much more comprehensive, objective and accurate view of a tropical cyclone’s wind field as it progresses and evolves throughout the Atlantic Basin.” Another key advantage of the specific data the firm provides is that many of the stations are situated in highly built-up areas. “This helps us get a much more accurate depiction of wind speeds and hazards in areas where there are significant amounts of exposure,” Waters points out. According to Hoekzema, this data helps RMS gain a much more defined picture of how tropical cyclone events are evolving. “Earth Networks has thousands of unique observation points that are available to RMS for their proprietary analysis. The network provides unique locations along the U.S. coasts and across the Caribbean. These locations are live observation points, so data can be ingested at high temporal resolutions.” Across the Network Earth Networks operates the world’s largest weather network, with more than 12,000 neighborhood-level sensors installed at locations such as schools, businesses and government buildings. “Our stations are positioned on sturdy structures and able to withstand the worst weather a hurricane can deliver,” explains Hoekzema. Being positioned at such sites also means that the stations benefit from more reliable power sources and can capitalize on high-speed Internet connectivity to ensure the flow of data is maintained during extreme events. In September 2017, an Earth Networks weather station located at the Naples Airport in Florida was the source for one of the highest-recorded wind gusts from Hurricane Irma, registering 131 miles per hour. “The station operated through the entire storm,” he adds. “Through our linkup with Earth Networks … we can ingest data on multiple meteorological variables in almost real time” Jeff waters RMS This network of stations collates a colossal amount of data, with Earth Networks processing some 25 terabytes of data relating to over 25 weather variables on a daily basis, with information refreshed every few minutes. “The weather stations record many data elements,” he says, “including temperature, wind speed, wind gust, wind direction, humidity, dew point and many others. Because the stations are sending data in real time, Earth Networks stations also send very reliable rate information — or how the values are changing in real time. Real-time rate information provides valuable data on how a storm is developing and moving and what extreme changes could be happening on the ground.” Looking Further Ahead For RMS, such pinpoint data is not only helping ensure a continuous data feed during major tropical cyclone events but will also contribute to efforts to enhance the quality of insights delivered prior to landfall. “We’re currently working on the forecasting component of our HWind product suite,” says Waters. “Harnessing this hyperlocal data alongside weather forecast models will help us gain a more accurate picture of possible track and intensity scenarios leading up to landfall, and allow users to quantify the potential impacts to their book of business should some of these scenarios pan out.” RMS is also looking at the possibility of capitalizing on Earth Networks’ data for other perils, including flooding and wildfire, with the company set to release its North America Wildfire HD Models in the fall. For Earth Networks, the firm is capitalizing on new technologies to expand its data reach. “Weather data is being captured by autonomous vehicles such as self-driving cars and drones,” explains Hoekzema. “More and more sensors are going to be sampling areas of the globe and levels of the atmosphere that have never been measured,” he concludes. “As a broader variety of data is made available, AI-based models will be used to drive a broader array of decisions within weather-influenced industries.”
