
EXPOSURE
The Moody's insurance solutions magazine with a unique perspective and clear mission “... to provide insight and analysis to help insurance and risk professionals innovate, adapt, and deliver.”

Insurance: The next 10 years
Mohsen Rahnama, Cihan Biyikoglu and Moe Khosravy of RMS look to 2029, consider the…
Times Square, New York City
Tag: wildfire
The Data Driving Wildfire Exposure Reduction
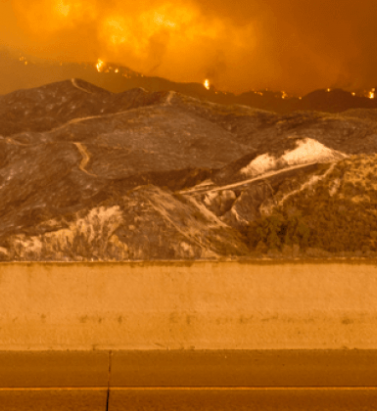
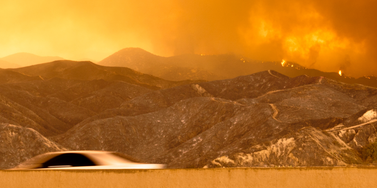
May 05, 2021Recent research by RMS® in collaboration with the CIPR and IBHS is helping move the dial on wildfire risk assessment, providing a benefit-cost analysis of science-based mitigation strategies The significant increase in the impact of wildfire activity in North America in the last four years has sparked an evolving insurance problem. Across California, for example, 235,250 homeowners’ insurance policies faced non-renewal in 2019, an increase of 31 percent over the previous year. In addition, areas of moderate to very-high risk saw a 61 percent increase – narrow that to the top 10 counties and the non-renewal rate exceeded 200 percent. A consequence of this insurance availability and affordability emergency is that many residents have sought refuge in the California FAIR (Fair Access to Insurance Requirements) Plan, a statewide insurance pool that provides wildfire cover for dwellings and commercial properties. In recent years, the surge in wildfire events has driven a huge rise in people purchasing cover via the plan, with numbers more than doubling in highly exposed areas. In November 2020, in an effort to temporarily help the private insurance market and alleviate pressure on the FAIR Plan, California Insurance Commissioner Ricardo Lara took the extraordinary step of introducing a mandatory one-year moratorium on insurance companies non-renewing or canceling residential property insurance policies. The move was designed to help the 18 percent of California’s residential insurance market affected by the record 2020 wildfire season. The Challenge of Finding an Exit “The FAIR Plan was only ever designed as a temporary landing spot for those struggling to find fire-related insurance cover, with homeowners ultimately expected to shift back into the private market after a period of time,” explains Jeff Czajkowski, director of the Center for Insurance Policy and Research (CIPR) at the National Association of Insurance Commissioners. “The challenge that they have now, however, is that the lack of affordable cover means for many of those who enter the plan there is potentially no real exit strategy.” The FAIR Plan was only ever designed as a temporary landing spot for those struggling to find fire-related insurance cover, with homeowners ultimately expected to shift back into the private market after a period of time. The challenge that they have now, however, is that the lack of affordable cover means for many of those who enter the plan there is potentially no real exit strategy. Jeff Czajkowski, director of the Center for Insurance Policy and Research (CIPR) at the National Association of Insurance Commissioners These concerns are echoed by Matt Nielsen, senior director of global governmental and regulatory affairs at RMS. “Eventually you run into similar problems to those experienced in Florida when they sought to address the issue of hurricane cover. You simply end up with so many policies within the plan that you have to reassess the risk transfer mechanism itself and look at who is actually paying for it.” The most expedient way to develop an exit strategy is to reduce wildfire exposure levels, which in turn will stimulate activity in the private insurance market and lead to the improved availability and affordability of cover in exposed regions. Yet therein lies the challenge. There is a fundamental stumbling block to this endeavor unique to California’s insurance market and enshrined in regulation. California Code of Regulations, Article 4 – Determination of Reasonable Rates, §2644.5 – Catastrophe Adjustment: “In those insurance lines and coverages where catastrophes occur, the catastrophic losses of any one accident year in the recorded period are replaced by a loading based on a multi-year, long-term average of catastrophe claims. The number of years over which the average shall be calculated shall be at least 20 years for homeowners’ multiple peril fire. …” In effect, this regulation prevents the use of predictive modeling, the mainstay of exposure assessment and accurate insurance pricing, and limits the scope of applicable data to the last 20 years. That might be acceptable if wildfire constituted a relatively stable exposure and if all aspects of the risk could be effectively captured in a period of two decades – but as the last few years have demonstrated, that is clearly not the case. As Roy Wright, president and CEO of the Insurance Institute for Business & Home Safety (IBHS), states: “Simply looking back might be interesting, but is it relevant? I don’t mean that the data gathered over the last 20 years is irrelevant, but on its own it is insufficient to understand and get ahead of wildfire risk, particularly when you apply the last four years to the 20-year retrospective, which have significantly skewed the market. That is when catastrophe models provide the analytical means to rationalize such deviations and to anticipate how this threat might evolve.” Simply looking back might be interesting, but is it relevant? I don’t mean that the data gathered over the last 20 years is irrelevant, but on its own it is insufficient to understand and get ahead of wildfire risk, particularly when you apply the last four years to the 20-year retrospective, which have significantly skewed the market. Roy Wright, president and CEO, Insurance Institute for Business & Home Safety (IBHS) The insurance industry has long viewed wildfire as an attritional risk, but such a perspective is no longer valid, believes Michael Young, senior director of product management at RMS. “It is only in the last five years that we are starting to see wildfire damaging thousands of buildings in a single event,” he says. “We are reaching the level where the technology associated with cat modeling has become critical because without that analysis you can’t predict future trends. The significant increase in related losses means that it has the potential to be a solvency-impacting peril as well as a rate-impacting one.” Addressing the Insurance Equation “Wildfire by its nature is a hyper-localized peril, which makes accurate assessment very data dependent,” Young continues. “Yet historically, insurers have relied upon wildfire risk scores to guide renewal decisions or to write new business in the wildland-urban interface (WUI). Such approaches often rely on zip-code-level data, which does not factor in environmental, community or structure-level mitigation measures. That lack of ground-level data to inform underwriting decisions means, often, non-renewal is the only feasible approach in highly exposed areas for insurers.” California is unique as it is the only U.S. state to stipulate that predictive modeling cannot be applied to insurance rate adjustments. However, this limitation is currently coming under significant scrutiny from all angles. In recent months, the California Department of Insurance has convened two separate investigatory hearings to address areas including: Insurance availability and affordability Need for consistent home-hardening standards and insurance incentives for mitigation Lack of transparency from insurers on wildfire risk scores and rate justification In support of efforts to demonstrate the need for a more data-driven, model-based approach to stimulating a healthy private insurance market, the CIPR, in conjunction with IBHS and RMS, has worked to facilitate greater collaboration between regulators, the scientific community and risk modelers in an effort to raise awareness of the value that catastrophe models can bring. “The Department of Insurance and all other stakeholders recognize that until we can create a well-functioning insurance market for wildfire risk, there will be no winners,” says Czajkowski. “That is why we are working as a conduit to bring all parties to the table to facilitate productive dialogue. A key part of this process is raising awareness on the part of the regulator both around the methodology and depth of science and data that underpins the cat model outputs.” In November 2020, as part of this process, CIPR, RMS and IBHS co-produced a report entitled “Application of Wildfire Mitigation to Insured Property Exposure.” “The aim of the report is to demonstrate the ability of cat models to reflect structure-specific and community-level mitigation measures,” Czajkowski continues, “based on the mitigation recommendations of IBHS and the National Fire Protection Association’s Firewise USA recognition program. It details the model outputs showing the benefits of these mitigation activities for multiple locations across California, Oregon and Colorado. Based on that data, we also produced a basic benefit-cost analysis of these measures to illustrate the potential economic viability of home-hardening measures.” Applying the Hard Science The study aims to demonstrate that learnings from building science research can be reflected in a catastrophe model framework and proactively inform decision-making around the reduction of wildfire risk for residential homeowners in wildfire zones. As Wright explains, the hard science that IBHS has developed around wildfire is critical to any model-based mitigation drive. “For any model to be successful, it needs to be based on the physical science. In the case of wildfire, for example, our research has shown that flame-driven ignitions account for approximately only a small portion of losses, while the vast majority are ember-driven. “Our facilities at IBHS enable us to conduct full-scale testing using single- and multi-story buildings, assessing components that influence exposure such as roofing materials, vents, decks and fences, so we can generate hard data on the various impacts of flame, ember, smoke and radiant heat. We can provide the physical science that is needed to analyze secondary and tertiary modifiers—factors that drive so much of the output generated by the models.” Our facilities at IBHS enable us to conduct full-scale testing using single- and multi-story buildings, assessing components that influence exposure such as roofing materials, vents, decks and fences, so we can generate hard data on the various impacts of flame, ember, smoke and radiant heat. Roy Wright, president and CEO, Insurance Institute for Business & Home Safety (IBHS) To quantify the benefits of various mitigation features, the report used the RMS® U.S. Wildfire HD Model to quantify hypothetical loss reduction benefits in nine communities across California, Colorado and Oregon. The simulated reductions in losses were compared to the costs associated with the mitigation measures, while a benefit-cost methodology was applied to assess the economic effectiveness of the two overall mitigation strategies modeled: structural mitigation and vegetation management. The multitude of factors that influence the survivability of a structure exposed to wildfire, including the site hazard parameters and structural characteristics of the property, were assessed in the model for 1,161 locations across the communities, three in each state. Each structure was assigned a set of primary characteristics based on a series of assumptions. For each property, RMS performed five separate mitigation case runs of the model, adjusting the vulnerability curves based on specific site hazard and secondary modifier model selections. This produced a neutral setting with all secondary modifiers set to zero—no penalty or credit applied—plus two structural mitigation scenarios and two vegetation management scenarios combined with the structural mitigation. The Direct Value of Mitigation Given the scale of the report, although relatively small in terms of the overall scope of wildfire losses, it is only possible to provide a snapshot of some of the key findings. The full report is available to download. Focusing on the three communities in California—Upper Deerwood (high risk), Berry Creek (high risk) and Oroville (medium risk)—the neutral setting produced an average annual loss (AAL) per structure of $3,169, $637 and $35, respectively. Figure 1: Financial impact of adjusting the secondary modifiers to produce both a structural (STR) credit and penaltyFigure 1 shows the impact of adjusting the secondary modifiers to produce a structural (STR) maximum credit (i.e., a well-built, wildfire-resistant structure) and a structural maximum penalty (i.e., a poorly built structure with limited resistance). In the case of Upper Deerwood, the applied credit saw an average reduction of $899 (i.e., wildfire-avoided losses) compared to the neutral setting, while conversely the penalty increased the AAL on average $2,409. For Berry Creek, the figures were a reduction of $222 and an increase of $633. And for Oroville, which had a relatively low neutral setting, the average reduction was $26. Figure 2: Financial analysis of the mean AAL difference for structural (STR) and vegetation (VEG) credit and penalty scenariosIn Figure 2 above, analyzing the mean AAL difference for structural and vegetation (VEG) credit and penalty scenarios revealed a reduction of $2,018 in Upper Deerwood and an increase of $2,511. The data, therefore, showed that moving from a poorly built to well-built structure on average reduced wildfire expected losses by $4,529. For Berry Creek, this shift resulted in an average savings of $1,092, while for Oroville there was no meaningful difference. The authors then applied three cost scenarios based on a range of wildfire mitigation costs: low ($20,000 structural, $25,000 structural and vegetation); medium ($40,000 structural, $50,000 structural and vegetation); and high ($60,000 structural, $75,000 structural and vegetation). Focusing again on the findings for California, the model outputs showed that in the low-cost scenario (and 1 percent discount rate) for 10-, 25- and 50-year time horizons, both structural only as well as structural and vegetation wildfire mitigation were economically efficient on average in the Upper Deerwood, California, community. For Berry Creek, California, economic efficiency for structural mitigation was achieved on average in the 50-year time horizon and in the 25- and 50-year time horizons for structural and vegetation mitigation. Moving the Needle Forward As Young recognizes, the scope of the report is insufficient to provide the depth of data necessary to drive a market shift, but it is valuable in the context of ongoing dialogue. “This report is essentially a teaser to show that based on modeled data, the potential exists to reduce wildfire risk by adopting mitigation strategies in a way that is economically viable for all parties,” he says. “The key aspect about introducing mitigation appropriately in the context of insurance is to allow the right differential of rate. It is to give the right signals without allowing that differential to restrict the availability of insurance by pricing people out of the market.” That ability to differentiate at the localized level will be critical to ending what he describes as the “peanut butter” approach—spreading the risk—and reducing the need to adopt a non-renewal strategy for highly exposed areas. “You have to be able to operate at a much more granular level,” he explains, “both spatially and in terms of the attributes of the structure, given the hyperlocalized nature of the wildfire peril. Risk-based pricing at the individual location level will see a shift away from the peanut-butter approach and reduce the need for widespread non-renewals. You need to be able to factor in not only the physical attributes, but also the actions by the homeowner to reduce their risk. Risk-based pricing at the individual location level will see a shift away from the peanut-butter approach and reduce the need for widespread non-renewals. You need to be able to factor in not only the physical attributes, but also the actions by the homeowner to reduce their risk. Michael Young, senior director of product management at RMS “It is imperative we create an environment in which mitigation measures are acknowledged, that the right incentives are applied and that credit is given for steps taken by the property owner and the community. But to reach that point, you must start with the modeled output. Without that analysis based on detailed, scientific data to guide the decision-making process, it will be incredibly difficult for the market to move forward.” As Czajkowski concludes: “There is no doubt that more research is absolutely needed at a more granular level across a wider playing field to fully demonstrate the value of these risk mitigation measures. However, what this report does is provide a solid foundation upon which to stimulate further dialogue and provide the momentum for the continuation of the critical data-driven work that is required to help reduce exposure to wildfire.”
Data From the Ashes
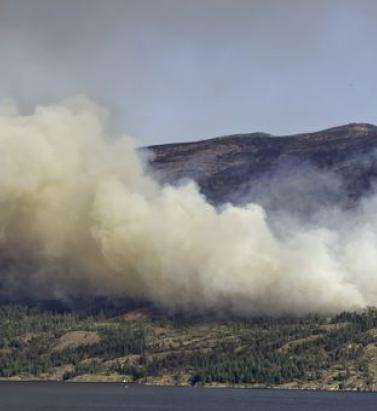
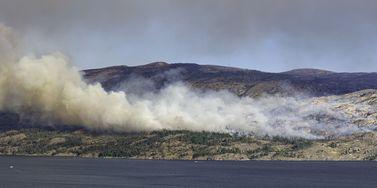
May 05, 2021Five years on from the wildfire that devastated Fort McMurray, the event has proved critical to developing a much deeper understanding of wildfire losses in Canada In May 2016, Fort McMurray, Alberta, became the location of Canada’s costliest wildfire event to date. In total, some 2,400 structures were destroyed by the fire, with a similar number designated as uninhabitable. Fortunately, the evacuation of the 90,000-strong population meant that no lives were lost as a direct result of the fires. From an insurance perspective, the estimated CA$4 billion loss elevated wildfire risk to a whole new level. This was a figure now comparable to the extreme fire losses experienced in wildfire-exposed regions such as California, and established wildfire as a peak natural peril second only to flood in Canada. However, the event also exposed gaps in the market’s understanding of wildfire events and highlighted the lack of actionable exposure data. In the U.S., significant investment had been made in enhancing the scale and granularity of publicly available wildfire data through bodies such as the United States Geological Survey, but the resolution of data available through equivalent parties in Canada was not at the same standard. A Question of Scale Making direct wildfire comparisons between the U.S. and Canada is difficult for multiple reasons. Take, for example, population density. Canada’s total population is approximately 37.6 million, spread over a landmass of 9,985 million square kilometers (3,855 million square miles), while California has a population of around 39.5 million, inhabiting an area of 423,970 square kilometers (163,668 square miles). The potential for wildfire events impacting populated areas is therefore significantly less in Canada. In fact, in the event of a wildfire in Canada—due to the reduced potential exposure—fires are typically allowed to burn for longer and over a wider area, whereas in the U.S. there is a significant focus on fire suppression. This willingness to let fires burn has the benefit of reducing levels of vegetation and fuel buildup. Also, more fires in the country are a result of natural rather than human-caused ignitions and occur in hard-to-access areas with low population exposure. Sixty percent of fires in Canada are attributed to human causes. The challenge for the insurance industry in Canada is therefore more about measuring the potential impact of wildfire on smaller pockets of exposure Michael Young, senior director, product management, at RMS But as Fort McMurray showed, the potential for disaster clearly exists. In fact, the event was one of a series of large-scale fires in recent years that have impacted populated areas in Canada, including the Okanagan Mountain Fire, the McLure Fire, the Slave Lake Fire, and the Williams Lake and Elephant Hills Fire. “The challenge for the insurance industry in Canada,” explains Michael Young, senior director, product management, at RMS, “is therefore more about measuring the potential impact of wildfire on smaller pockets of exposure, rather than the same issues of frequency and severity of event that are prevalent in the U.S.” Regions at Risk What is interesting to note is just how much of the populated territories are potentially exposed to wildfire events in Canada, despite a relatively low population density overall. A 2017 report entitled Mapping Canadian Wildland Fire Interface Areas, published by the Canadian Forest Service, stated that the threat of wildfire impacting populated areas will inevitably increase as a result of the combined impacts of climate change and the development of more interface area “due to changes in human land use.” This includes urban and rural growth, the establishment of new industrial facilities and the building of more second homes. According to the study, the wildland-human interface in Canada spans 116.5 million hectares (288 million acres), which is 13.8 percent of the country’s total land area or 20.7 percent of its total wildland fuel area. In terms of the wildland-urban interface (WUI), this covers 32.3 million hectares (79.8 million acres), which is 3.8 percent of land area or 5.8 percent of fuel area. The WUI for industrial areas (known as WUI-Ind) covers 10.5 million hectares (25.9 million acres), which is 1.3 percent of land area or 1.9 percent of fuel area. In terms of the provinces and territories with the largest interface areas, the report highlighted Quebec, Alberta, Ontario and British Columbia as being most exposed. At a more granular level, it stated that in populated areas such as cities, towns and settlements, 96 percent of locations had “at least some WUI within a five-kilometer buffer,” while 60 percent also had over 500 hectares (1,200 acres) of WUI within a five-kilometer buffer (327 of the total 544 areas). Data: A Closer Look Fort McMurray has, in some ways, become an epicenter for the generation of wildfire-related data in Canada. According to a study by the Institute for Catastrophic Loss Reduction, which looked at why certain homes survived, the Fort McMurray Wildfire “followed a well-recognized pattern known as the wildland/urban interface disaster sequence.” The detailed study, which was conducted in the aftermath of the disaster, showed that 90 percent of properties in the areas affected by the wildfire survived the event. Further, “surviving homes were generally rated with ‘Low’ to ‘Moderate’ hazard levels and exhibited many of the attributes promoted by recommended FireSmart Canada guidelines.” FireSmart Canada is an organization designed to promote greater wildfire resilience across the country. Similar to FireWise in the U.S., it has created a series of hazard factors spanning aspects such as building structure, vegetation/fuel, topography and ignition sites. It also offers a hazard assessment system that considers hazard layers and adoption rates of resilience measures. According to the study: “Tabulation by hazard level shows that 94 percent of paired comparisons of all urban and country residential situations rated as having either ‘Low’ or ‘Moderate’ hazard levels survived the wildfire. Collectively, vegetation/fuel conditions accounted for 49 percent of the total hazard rating at homes that survived and 62 percent of total hazard at homes that failed to survive.” Accessing the Data In many ways, the findings of the Fort McMurray study are reassuring, as they clearly demonstrate the positive impact of structural and topographical risk mitigation measures in enhancing wildfire resilience—essentially proving the underlying scientific data. Further, the data shows that “a strong, positive correlation exists between home destruction during wildfire events and untreated vegetation within 30 meters of homes.” “What the level of survivability in Fort McMurray showed was just how important structural hardening is,” Young explains. “It is not simply about defensible space, managing vegetation and ensuring sufficient distance from the WUI. These are clearly critical components of wildfire resilience, but by factoring in structural mitigation measures you greatly increase levels of survivability, even during urban conflagration events as extreme as Fort McMurray.” What the level of survivability in Fort McMurray showed was just how important structural hardening is Michael Young, senior director, product management, RMS From an insurance perspective, access to these combined datasets is vital to effective exposure analysis and portfolio management. There is a concerted drive on the part of the Canadian insurance industry to adopt a more data-intensive approach to managing wildfire exposure. Enhancing data availability across the region has been a key focus at RMS® in recent years, and efforts have culminated in the launch of the RMS® Canada Wildfire HD Model. It offers the most complete view of the country’s wildfire risk currently available and is the only probabilistic model available to the market that covers all 10 provinces. “The hazard framework that the model is built on spans all of the critical wildfire components, including landscape and fire behavior patterns, fire weather simulations, fire and smoke spread, urban conflagration and ember intensity,” says Young. “In each instance, the hazard component has been precisely calibrated to reflect the dynamics, assumptions and practices that are specific to Canada. “For example, the model’s fire spread component has been adjusted to reflect the fact that fires tend to burn for longer and over a wider area in the country, which reflects the watching brief that is often applied to managing wildfire events, as opposed to the more suppression-focused approach in the U.S.,” he continues. “Also, the urban conflagration component helps insurers address the issue of extreme tail-risk events such as Fort McMurray.” Another key model differentiator is the wildfire vulnerability function, which automatically determines key risk parameters based on high-resolution data. In fact, RMS has put considerable efforts into building out the underlying datasets by blending multiple different information sources to generate fire, smoke and ember footprints at 50-meter resolution, as opposed to the standard 250-meter resolution of the publicly available data. Critical site hazard data such as slope, distance to vegetation, and fuel types can be set against primary building modifiers such as construction, number of stories and year built. A further secondary modifier layer enables insurers to apply building-specific mitigation measures such as roof characteristics, ember accumulators and whether the property has cladding or a deck. Given the influence of such components on building survivability during the Fort McMurray Fire, such data is vital to exposure analysis at the local level. A Changing Market “The market has long recognized that greater data resolution is vital to adopting a more sophisticated approach to wildfire risk,” Young says. “As we worked to develop this new model, it was clear from our discussions with clients that there was an unmet need to have access to hard data that they could ‘hang numbers from.’ There was simply too little data to enable insurers to address issues such as potential return periods, accumulation risk and countrywide portfolio management.” The ability to access more granular data might also be well timed in response to a growing shift in the information required during the insurance process. There is a concerted effort taking place across the Canadian insurance market to reduce the information burden on policyholders during the submission process. At the same time, there is a shift toward risk-based pricing. “As we see this dynamic evolve,” Young says, “the reduced amount of risk information sourced from the insured will place greater importance on the need to apply modeled data to how insurance companies manage and price risk accurately. Companies are also increasingly looking at the potential to adopt risk-based pricing, a process that is dependent on the ability to apply exposure analysis at the individual location level. So, it is clear from the coming together of these multiple market shifts that access to granular data is more important to the Canadian wildfire market than ever.”


Location, Location, Location: A New Era in Data Resolution
February 11, 2021The insurance industry has reached a transformational point in its ability to accurately understand the details of exposure at risk. It is the point at which three fundamental components of exposure management are coming together to enable (re)insurers to systematically quantify risk at the location level: the availability of high-resolution location data, access to the technology to capture that data and advances in modeling capabilities to use that data. Data resolution at the individual building level has increased considerably in recent years, including the use of detailed satellite imagery, while advances in data sourcing technology have provided companies with easier access to this more granular information. In parallel, the evolution of new innovations, such as RMS® High Definition Models™ and the transition to cloud-based technologies, has facilitated a massive leap forward in the ability of companies to absorb, analyze and apply this new data within their actuarial and underwriting ecosystems. Quantifying Risk Uncertainty “Risk has an inherent level of uncertainty,” explains Mohsen Rahnama, chief modeling officer at RMS. “The key is how you quantify that uncertainty. No matter what hazard you are modeling, whether it is earthquake, flood, wildfire or hurricane, there are assumptions being made. These catastrophic perils are low-probability, high-consequence events as evidenced, for example, by the 2017 and 2018 California wildfires or Hurricane Katrina in 2005 and Hurricane Harvey in 2017. For earthquake, examples include Tohoku in 2011, the New Zealand earthquakes in 2010 and 2011, and Northridge in 1994. For this reason, risk estimation based on an actuarial approach cannot be carried out for these severe perils; physical models based upon scientific research and event characteristic data for estimating risk are needed.” A critical element in reducing uncertainty is a clear understanding of the sources of uncertainty from the hazard, vulnerability and exposure at risk. “Physical models, such as those using a high-definition approach, systematically address and quantify the uncertainties associated with the hazard and vulnerability components of the model,” adds Rahnama. “There are significant epistemic (also known as systematic) uncertainties in the loss results, which users should consider in their decision-making process. This epistemic uncertainty is associated with a lack of knowledge. It can be subjective and is reducible with additional information.” What are the sources of this uncertainty? For earthquake, there is uncertainty about the ground motion attenuation functions, soil and geotechnical data, the size of the events, or unknown faults. Rahnama explains: “Addressing the modeling uncertainty is one side of the equation. Computational power enables millions of events and more than 50,000 years of simulation to be used, to accurately capture the hazard and reduce the epistemic uncertainty. Our findings show that in the case of earthquakes the main source of uncertainty for portfolio analysis is ground motion; however, vulnerability is the main driver of uncertainty for a single location.” The quality of the exposure data as the input to any mathematical models is essential to assess the risk accurately and reduce the loss uncertainty. However, exposure could represent the main source of loss uncertainty, especially when exposure data is provided in aggregate form. Assumptions can be made to disaggregate exposure using other sources of information, which helps to some degree reduce the associated uncertainty. Rahnama concludes, “Therefore, it is essential in order to minimize the uncertainty related to exposure to try to get location-level information about the exposure, in particular for the region with the potential of liquification for earthquake or for high-gradient hazard such as flood and wildfire.” A critical element in reducing that uncertainty, removing those assumptions and enhancing risk understanding is combining location-level data and hazard information. That combination provides the data basis for quantifying risk in a systematic way. Understanding the direct correlation between risk or hazard and exposure requires location-level data. The potential damage caused to a location by flood, earthquake or wind will be significantly influenced by factors such as first-floor elevation of a building, distance to fault lines or underlying soil conditions through to the quality of local building codes and structural resilience. And much of that granular data is now available and relatively easy to access. “The amount of location data that is available today is truly phenomenal,” believes Michael Young, vice president of product management at RMS, “and so much can be accessed through capabilities as widely available as Google Earth. Straightforward access to this highly detailed satellite imagery means that you can conduct desktop analysis of individual properties and get a pretty good understanding of many of the building and location characteristics that can influence exposure potential to perils such as wildfire.” Satellite imagery is already a core component of RMS model capabilities, and by applying machine learning and artificial intelligence (AI) technologies to such images, damage quantification and differentiation at the building level is becoming a much more efficient and faster undertaking — as demonstrated in the aftermath of Hurricanes Laura and Delta. “Within two days of Hurricane Laura striking Louisiana at the end of August 2020,” says Rahnama, “we had been able to assess roof damage to over 180,000 properties by applying our machine-learning capabilities to satellite images of the affected areas. We have ‘trained’ our algorithms to understand damage degree variations and can then superimpose wind speed and event footprint specifics to group the damage degrees into different wind speed ranges. What that also meant was that when Hurricane Delta struck the same region weeks later, we were able to see where damage from these two events overlapped.” The Data Intensity of Wildfire Wildfire by its very nature is a data-intensive peril, and the risk has a steep gradient where houses in the same neighborhood can have drastically different risk profiles. The range of factors that can make the difference between total loss, partial loss and zero loss is considerable, and to fully grasp their influence on exposure potential requires location-level data. The demand for high-resolution data has increased exponentially in the aftermath of recent record-breaking wildfire events, such as the series of devastating seasons in California in 2017-18, and unparalleled bushfire losses in Australia in 2019-20. Such events have also highlighted myriad deficiencies in wildfire risk assessment including the failure to account for structural vulnerabilities, the inability to assess exposure to urban conflagrations, insufficient high-resolution data and the lack of a robust modeling solution to provide insight about fire potential given the many years of drought. Wildfires in 2017 devastated the town of Paradise, California In 2019, RMS released its U.S. Wildfire HD Model, built to capture the full impact of wildfire at high resolution, including the complex behaviors that characterize fire spread, ember accumulation and smoke dispersion. Able to simulate over 72 million wildfires across the contiguous U.S., the model creates ultrarealistic fire footprints that encompass surface fuels, topography, weather conditions, moisture and fire suppression measures. “To understand the loss potential of this incredibly nuanced and multifactorial exposure,” explains Michael Young, “you not only need to understand the probability of a fire starting but also the probability of an individual building surviving. “If you look at many wildfire footprints,” he continues, “you will see that sometimes up to 60 percent of buildings within that footprint survived, and the focus is then on what increases survivability — defensible space, building materials, vegetation management, etc. We were one of the first modelers to build mitigation factors into our model, such as those building and location attributes that can enhance building resilience.” Moving the Differentiation Needle In a recent study by RMS and the Center for Insurance Policy Research, the Insurance Institute for Business and Home Safety and the National Fire Protection Association, RMS applied its wildfire model to quantifying the benefits of two mitigation strategies — structural mitigation and vegetation management — assessing hypothetical loss reduction benefits in nine communities across California, Colorado and Oregon. Young says: “By knowing what the building characteristics and protection measures are within the first 5 feet and 30 feet at a given property, we were able to demonstrate that structural modifications can reduce wildfire risk up to 35 percent, while structural and vegetation modifications combined can reduce it by up to 75 percent. This level of resolution can move the needle on the availability of wildfire insurance as it enables development of robust rating algorithms to differentiate specific locations — and means that entire neighborhoods don’t have to be non-renewed.” “By knowing what the building characteristics and protection measures are within the first 5 feet and 30 feet at a given property, we were able to demonstrate that structural modifications can reduce wildfire risk up to 35 percent, while structural and vegetation modifications combined can reduce it by up to 75 percent” Michael Young, RMS While acknowledging that modeling mitigation measures at a 5-foot resolution requires an immense granularity of data, RMS has demonstrated that its wildfire model is responsive to data at that level. “The native resolution of our model is 50-meter cells, which is a considerable enhancement on the zip-code level underwriting grids employed by some insurers. That cell size in a typical suburban neighborhood encompasses approximately three-to-five buildings. By providing the model environment that can utilize information within the 5-to-30-foot range, we are enabling our clients to achieve the level of data fidelity to differentiate risks at that property level. That really is a potential market game changer.” Evolving Insurance Pricing It is not hyperbolic to suggest that being able to combine high-definition modeling with high-resolution data can be market changing. The evolution of risk-based pricing in New Zealand is a case in point. The series of catastrophic earthquakes in the Christchurch region of New Zealand in 2010 and 2011 provided a stark demonstration of how insufficient data meant that the insurance market was blindsided by the scale of liquefaction-related losses from those events. “The earthquakes showed that the market needed to get a lot smarter in how it approached earthquake risk,” says Michael Drayton, consultant at RMS, “and invest much more in understanding how individual building characteristics and location data influenced exposure performance, particularly in relation to liquefaction. “To get to grips with this component of the earthquake peril, you need location-level data,” he continues. “To understand what triggers liquefaction, you must analyze the soil profile, which is far from homogenous. Christchurch, for example, sits on an alluvial plain, which means there are multiple complex layers of silt, gravel and sand that can vary significantly from one location to the next. In fact, across a large commercial or industrial complex, the soil structure can change significantly from one side of the building footprint to the other.” Extensive building damage in downtown Christchurch, New Zealand after 2011 earthquakeThe aftermath of the earthquake series saw a surge in soil data as teams of geotech engineers conducted painstaking analysis of layer composition. With multiple event sets to use, it was possible to assess which areas suffered soil liquefaction and from which specific ground-shaking intensity. “Updating our model with this detailed location information brought about a step-change in assessing liquefaction exposures. Previously, insurers could only assess average liquefaction exposure levels, which was of little use where you have highly concentrated risks in specific areas. Through our RMS® New Zealand Earthquake HD Model, which incorporates 100-meter grid resolution and the application of detailed ground data, it is now possible to assess liquefaction exposure potential at a much more localized level.” “Through our RMS® New Zealand Earthquake HD model, which incorporates 100-meter grid resolution and the application of detailed ground data, it is now possible to assess liquefaction exposure potential at a much more localized level” — Michael Drayton, RMS This development represents a notable market shift from community to risk-based pricing in New Zealand. With insurers able to differentiate risks at the location level, this has enabled companies such as Tower Insurance to more accurately adjust premium levels to reflect risk to the individual property or area. In its annual report in November 2019, Tower stated: “Tower led the way 18 months ago with risk-based pricing and removing cross-subsidization between low- and high-risk customers. Risk-based pricing has resulted in the growth of Tower’s portfolio in Auckland while also reducing exposure to high-risk areas by 16 percent. Tower’s fairer approach to pricing has also allowed the company to grow exposure by 4 percent in the larger, low-risk areas like Auckland, Hamilton, and Taranaki.” Creating the Right Ecosystem The RMS commitment to enable companies to put high-resolution data to both underwriting and portfolio management use goes beyond the development of HD Models™ and the integration of multiple layers of location-level data. Through the launch of RMS Risk Intelligence™, its modular, unified risk analytics platform, and the Risk Modeler™ application, which enables users to access, evaluate, compare and deploy all RMS models, the company has created an ecosystem built to support these next-generation data capabilities. Deployed within the Cloud, the ecosystem thrives on the computational power that this provides, enabling proprietary and tertiary data analytics to rapidly produce high-resolution risk insights. A network of applications — including the ExposureIQ™ and SiteIQ™ applications and Location Intelligence API — support enhanced access to data and provide a more modular framework to deliver that data in a much more customized way. “Because we are maintaining this ecosystem in the Cloud,” explains Michael Young, “when a model update is released, we can instantly stand that model side-by-side with the previous version. As more data becomes available each season, we can upload that new information much faster into our model environment, which means our clients can capitalize on and apply that new insight straightaway.” Michael Drayton adds: “We’re also offering access to our capabilities in a much more modular fashion, which means that individual teams can access the specific applications they need, while all operating in a data-consistent environment. And the fact that this can all be driven through APIs means that we are opening up many new lines of thought around how clients can use location data.” Exploring What Is Possible There is no doubt that the market is on the cusp of a new era of data resolution — capturing detailed hazard and exposure and using the power of analytics to quantify the risk and risk differentiation. Mohsen Rahnama believes the potential is huge. “I foresee a point in the future where virtually every building will essentially have its own social-security-like number,” he believes, “that enables you to access key data points for that particular property and the surrounding location. It will effectively be a risk score, including data on building characteristics, proximity to fault lines, level of elevation, previous loss history, etc. Armed with that information — and superimposing other data sources such as hazard data, geological data and vegetation data — a company will be able to systematically price risk and assess exposure levels for every asset up to the portfolio level.” “The only way we can truly assess this rapidly changing risk is by being able to systematically evaluate exposure based on high-resolution data and advanced modeling techniques that incorporate building resilience and mitigation measures” — Mohsen Rahnama, RMS Bringing the focus back to the here and now, he adds, the expanding impacts of climate change are making the need for this data transformation a market imperative. “If you look at how many properties around the globe are located just one meter above sea level, we are talking about trillions of dollars of exposure. The only way we can truly assess this rapidly changing risk is by being able to systematically evaluate exposure based on high-resolution data and advanced modeling techniques that incorporate building resilience and mitigation measures. How will our exposure landscape look in 2050? The only way we will know is by applying that data resolution underpinned by the latest model science to quantify this evolving risk.”


Climate Change: The Cost of Inaction
May 05, 2020With pressure from multiple directions for a change in the approach to climate risk, how the insurance industry responds is under scrutiny Severe threats to the climate account for all of the top long-term risks in this year’s World Economic Forum (WEF) “Global Risks Report.” For the first time in the survey’s 10-year outlook, the top five global risks in terms of likelihood are all environmental. From an industry perspective, each one of these risks has potentially significant consequences for insurance and reinsurance companies: Extreme weather events with major damage to property, infrastructure and loss of human life Failure of climate change mitigation and adaptation by governments and businesses Man-made environmental damage and disasters including massive oil spills and incidents of radioactive contamination Major biodiversity loss and ecosystem collapse (terrestrial or marine) with irreversible consequences for the environment, resulting in severely depleted resources for humans as well as industries Major natural disasters such as earthquakes, tsunamis, volcanic eruptions and geomagnetic storms “There is mounting pressure on companies from investors, regulators, customers and employees to demonstrate their resilience to rising climate volatility,” says John Drzik, chairman of Marsh and McLennan Insights. “Scientific advances mean that climate risks can now be modeled with greater accuracy and incorporated into risk management and business plans. High-profile events, like recent wildfires in Australia and California, are adding pressure on companies to take action on climate risk.” There is mounting pressure on companies from investors, regulators, customers and employees to demonstrate their resilience to rising climate volatility” John Drzik Marsh and McLennan Insights In December 2019, the Bank of England introduced new measures for insurers, expecting them to assess, manage and report on the financial risks of climate change as part of the bank’s 2021 Biennial Exploratory Scenario (BES) exercise. The BES builds on the Prudential Regulatory Authority’s Insurance Stress Test 2019, which asked insurers to stress test their assets and liabilities based on a series of future climate scenarios. The Network for the Greening of the Financial System shows how regulators in other countries are moving in a similar direction. “The BES is a pioneering exercise, which builds on the considerable progress in addressing climate-related risks that has already been made by firms, central banks and regulators,” said outgoing Bank of England governor Mark Carney. “Climate change will affect the value of virtually every financial asset; the BES will help ensure the core of our financial system is resilient to those changes.” The insurance industry’s approach to climate change is evolving. Industry-backed groups such as ClimateWise have been set up to respond to the challenges posed by climate change while also influencing policymakers. “Given the continual growth in exposure to natural catastrophes, insurance can no longer simply rely on a strategy of assessing and re-pricing risk,” says Maurice Tulloch, former chair of ClimateWise and CEO of international insurance at Aviva. “Doing so threatens a rise of uninsurable markets.” The Cost of Extreme Events In the past, property catastrophe (re)insurers were able to recalibrate their perception of natural catastrophe risk on an annual basis, as policies came up for renewal, believing that changes to hazard frequency and/or severity would occur incrementally over time. However, it has become apparent that some natural hazards have a much greater climate footprint than had been previously imagined. Attribution studies are helping insurers and other stakeholders to measure the financial impact of climate change on a specific event. “You have had events in the last few years that have a climate change signature to them,” says Robert Muir-Wood, chief research officer of science and technology at RMS. “That could include wildfire in California or extraordinary amounts of rainfall during Hurricane Harvey over Houston, or the intensity of hurricanes in the Caribbean, such as Irma, Maria and Dorian. “These events appear to be more intense and severe than those that have occurred in the past,” he continues. “Attribution studies are corroborating the fact that these natural disasters really do have a climate change signature. It was a bit experimental to start with, but now it’s just become a regular part of the picture, that after every event a designated attribution study program will be undertaken … often by more than one climate lab. “In the past it was a rather futile argument whether or not an event had a greater impact because of climate change, because you couldn’t really prove the point,” he adds. “Now it’s possible to say not only if an event has a climate change influence, but by how much. The issue isn’t whether something was or was not climate change, it’s that climate change has affected the probability of an event like that by this amount. That is the nature of the conversation now, which is an intelligent way of thinking about it.” Now it’s possible to say not only if an event has a climate change influence, but by how much. The issue isn’t whether something was or was not climate change, it’s that climate change has affected the probability of an event like that by this amount Robert Muir-Wood RMS Record catastrophe losses in 2017 and 2018 — with combined claims costing insurers US$230 billion, according to Swiss Re sigma — have had a significant impact on the competitive and financial position of many property catastrophe (re)insurers. The loss tally from 2019 was less severe, with global insurance losses below the 10-year average at US$56 billion, but Typhoons Faxai and Hagibis caused significant damage to Japan when they occurred just weeks apart in September and October. “It can be argued that the insurance industry is the only sector that is going to be able to absorb the losses from climate change,” adds Muir-Wood. “Companies already feel they are picking up losses in this area and it’s a bit uncharted — you can’t just use the average of history. It doesn’t really work anymore. So, we need to provide the models that give our clients the comfort of knowing how to handle and price climate change risks in anticipation.” The Cost of Short-Termism While climate change is clearly on the agenda of the boards of international insurance and reinsurance firms, its emphasis differs from company to company, according to the Geneva Association. In a report, the industry think tank found that insurers are hindered from scaling up their contribution to climate adaptation and mitigation by barriers that are imposed at a public policy and regulatory level. The need to take a long-term view on climate change is at odds with the pressures that insurance companies are under as public and regulated entities. Shareholder expectations and the political demands to keep insurance rates affordable are in conflict with the need to charge a risk-adjusted price or reduce exposures in regions that are highly catastrophe exposed. Examples of this need to protect property owners from full risk pricing became an election issue in the Florida market when state-owned carrier Florida Citizens supported customers with effectively subsidized premiums. The disproportionate emphasis on using the historical record as a means of modeling the probability of future losses is a further challenge for the private market operating in the state. “In the past when insurers were confronted with climate change, they were comfortable with the sense that they could always put up the price or avoid writing the business if the risk got too high,” says Muir-Wood. “But I don’t think that’s a credible position anymore. We see situations, such as in California, where insurers are told they should already have priced in climate change risk and they need to use the average of the last 30 years, and that’s obviously a challenge for the solvency of insurers. Regulators want to be up to speed on this. If levels of risk are increasing, they need to make sure that (re)insurance companies can remain solvent. That they have enough capital to take on those risks. “The Florida Insurance Commissioner’s function is more weighted to look after the interests of consumers around insurance prices, and they maintain a very strong line that risk models should be calibrated against the long-term historical averages,” he continues. “And they’ve said that both in Florida for hurricane and in California for wildfire. And in a time of change and a time of increased risk, that position is clearly not in the interest of insurers, and they need to be thinking carefully about that. “Regulators want to be up to speed on this,” he adds. “If levels of risk are increasing, they need to make sure that (re)insurance companies can remain solvent. That they have enough capital to take on those risks. And supervisors will expect the companies they regulate to turn up with extremely good arguments and a demonstration of the data behind their position as to how they are pricing their risk and managing their portfolios.” The Reputational Cost of Inaction Despite the persistence of near-term pressures, a lack of action and a long-term view on climate change is no longer a viable option for the industry. In part, this is due to a mounting reputational cost. European and Australian (re)insurers have, for instance, been more proactive in divesting from fossil fuels than their American and Asian counterparts. This is expected to change as negative attention mounts in both mainstream and social media. The industry’s retreat from coal is gathering pace as public pressure on the fossil fuel industry and its supporters grows. The number of insurers withdrawing cover for coal more than doubled in 2019, with coal exit policies announced by 17 (re)insurance companies. “The role of insurers is to manage society’s risks — it is their duty and in their own interest to help avoid climate breakdown,” says Peter Bosshard, coordinator of the Unfriend Coal campaign. “The industry’s retreat from coal is gathering pace as public pressure on the fossil fuel industry and its supporters grows.” The influence of climate change activists such as Greta Thunberg, the actions of NGO pressure groups like Unfriend Coal and growing climate change disclosure requirements are building a critical momentum and scrutiny into the action (or lack thereof) taken by insurance senior management. “If you are in the driver’s seat of an insurance company and you know your customers’ attitudes are shifting quite fast, then you need to avoid looking as though you are behind the curve,” says Muir-Wood. “Quite clearly there is a reputational side to this. Attitudes are changing, and as an industry we should anticipate that all sorts of things that are tolerated today will become unacceptable in the future.” To understand your organization’s potential exposure to climate change contact the RMS team here
