


EXPOSURE
The RMS Magazine with a unique perspective and clear mission “... to provide insight and analysis to help insurance and risk professionals innovate, adapt, and deliver.”
Insurance: The next 10 years
Mohsen Rahnama, Cihan Biyikoglu and Moe Khosravy of RMS look to 2029, consider the…
Times Square, New York City
Tag: 2022 North Atlantic Hurricane Season
Can the Florida Insurance Market Withstand a US$100 Billion Repeat of Hurricane Andrew?
August 23, 2022Hurricane Andrew’s landfall in Florida in 1992 changed the face of property catastrophe insurance and kick-started many new initiatives, including the development of hurricane risk modeling. However, with significant exposure growth, the impact of social inflation, and climate change complications, the insurance market could struggle to respond to a repeat of Andrew. The wide-ranging impact of Hurricane Andrew on the Florida insurance market is a familiar story within the risk management world. However, 30 years on from August 24, 1992, when Andrew made landfall in Dade County, Florida, memories appear to be getting shorter, as the insurance industry once more seems to be in danger of underestimating its exposure to a Category 5 storm hitting the state. Image from the GOES-7 satellite shows Hurricane Andrew at its peak intensity on August 23, 1992, before making landfall near Homestead, Florida. Image source: NOAAWhen Hurricane Andrew came ashore as the first named tropical storm of the 1992 North Atlantic hurricane season, it followed a seven-year hiatus in major hurricane activity in Florida. Industry predictions at the time were that it would cost insurers around US$4 billion to US$5 billion, but Andrew ended up costing the insurance industry US$15 billion (in 1992 values) for Florida claims, and it caused the deaths of 44 people in the state. Following Hurricane Andrew, more than 650,000 claims were filed, leaving eight insurers becoming insolvent and a further three driven into insolvency the following year. Fast forward to today, and RMS® predictions for a repeat of Andrew would see the insured loss for wind and surge in the range of US$80 billion (GR) and US$90 billion (GU), in which other non-modeled losses and social inflation could lead to a US$100 billion event. Aftermath of Andrew The losses from Hurricane Andrew vindicated the need for catastrophe modeling solutions including the use of multiple simulated storms beyond those previously experienced in history. Catastrophe models enabled the new Bermuda reinsurance market: eight new reinsurers were established without the need for their own historical experience. In time, catastrophe models would enable the creation of insurance-linked securities such as catastrophe bonds, to tap into capital markets for alternatives to reinsurance. Without Hurricane Andrew, it might have taken much longer for this revolution to happen. The crisis caused by Andrew certainly precipitated some rapid and innovative changes to help manage a much larger hurricane risk cost than previously recognized, allowing the market to prepare for the hyperactive Florida hurricane seasons of 2004 and 2005. However, the following years were unusually quiet for intense storms landfalling in Florida, encouraging actions that further raised insurers’ hurricane risk costs. Among these was the 25 percent roof replacement rule in 2007, which mandated that if 25 percent or more of a roof is ‘repaired, replaced or recovered’ in any 12-month period, then the entire roofing system or roof section must be brought up to the latest building code. “Until the hurricanes returned with a vengeance in 2017,” says Peter Datin, senior director of modeling at RMS, “the significant additional cost imposed on insurers due to this code update was not clear.” Development of Hurricane Modeling Before Hurricane Andrew, exposure mapping by the insurance industry involved tracking premiums at a fairly coarse ‘Cresta Zone’ resolution. Post-Andrew, as modelers provided insurers with the ability to model exposures at a finer scale, insurers recognized how higher resolution data could provide a more accurate assessment of risk. RMS released its first hurricane model in 1993. Since then, there have been many updates and innovations, from basin-wide stochastic tracks, coupled ocean-atmosphere storm surge modeling, and significant enhancements in damage assessment modeling. After Hurricane Katrina in 2005, Robert Muir-Wood, chief research officer at RMS, coined the term ‘post-event loss amplification’ (PLA) to cover all processes that can raise losses after a major catastrophe, such as demand surge and claims inflation. Auguste Boissonnade, vice president of model development at RMS, who designed the first RMS hurricane model, worked on how to quantify these different factors in generating the overall insurance loss after cat events. Hurricane Katrina floodingFor the most extreme catastrophes, when damage requires the long-term evacuation of large parts of a city, the definition of a “super catastrophe” (or “super-cat”) event applies, where secondary consequences can be a significant component of the original damage. The flooding of New Orleans after Hurricane Katrina was such a super-cat. “With the hurricane catastrophes of 2004 and 2005 came the realization that cat loss models needed to allow for undervaluation of insured exposures as well as the secondary impact of economic, social, and political factors that could amplify the losses,” Boissonnade says. After major hurricanes, RMS vulnerability modelers review lessons that can be learned from the events and the resulting claims data. “Through claims analyses, it has been possible to quantify the degree to which changes in wind design codes have reduced damage and losses to buildings and incorporate those learnings into cat models,” added Datin. Current Market Dynamics The average cost of an annual homeowner’s policy in Florida is expected to soar to US$4,231 this year, almost three times the U.S. annual average, according to the Insurance Information Institute. Five Florida market insurers have already gone insolvent so far in 2022, faced with rising claims costs and increased costs for reinsurance. Meanwhile, the number of policies written by Citizens, a post-Andrew creation, has risen to over a million, as insurers have either gone insolvent, withdrawn capacity from the market, or had their ratings downgraded, making it harder for insureds to secure coverage that will meet their mortgage lenders’ approval. In July 2022, rating agency Demotech wrote to 17 insurers warning them they could be downgraded from A (exceptional) to S (substantial) or M (moderate), potentially impacting millions of policyholders whose mortgage providers demand home insurance from the strongest-rated carriers. Florida legislators then looked to circumvent the use of Demotech ratings with a new stopgap measure, where Citizens take on a reinsurance role to pay claims for insolvent insurers. At the same time, insurers are struggling to secure reinsurance capacity, and Citizens only managed to get a third of its desired reinsurance cover, making it harder for carriers to deploy sufficient capacity to meet the demand for hurricane coverage. There has also been a huge increase in the volume of catastrophe claims in recent years, driven by social inflation and undervaluation of exposures. Likely Impact of Andrew Now “Our prediction that a repeat of Andrew today could cause as much as US$100 billion in insured losses is based in large part on changes in exposure and population since 1992, coupled with updated predictions of the impact of wind and storm surge, with significant anticipated post-event loss amplification. Together these components reveal a more complete picture of potential economic and insured losses,” says Mohsen Rahnama, chief risk modeling officer at RMS. Combined wind and surge losses for a repeat of Hurricane Andrew are estimated at US$87 billion. Post-event loss amplification, whether it is from a slow recovery, supply chain issues from COVID-19, or current inflationary trends, could take the ultimate loss closer to US$100 billion. The impact of storm surge, particularly with the climate change-related rise in sea levels, is also more pronounced now compared to estimates at the time of Andrew. South Florida property developmentAdded to this is the significant demographic shift in Florida. As of this year, the population of Florida is estimated at over 22 million – a 61 percent increase from the number of people in 1992. Building counts in Andrew’s wind and surge footprints have increased by 40 percent to 1.9 million and by 32 percent to 55,000 respectively. Economic exposure has also increased by 77 percent in the wind footprint and 67 percent in the surge footprint. And in Miami-Dade County, the number of high-rise buildings that are over 15 stories has tripled since 1992, many of which are now potentially in Andrew’s surge footprint. “While the wind was the main driver of loss in 1992, the number of new, high-valued buildings near the coast suggests that storm surge losses may play an increasing role in a repeat of this event,” says Rahnama. In constant-dollar terms, economic exposure has grown substantially within both Andrew’s wind and surge footprints, based on an analysis of the total built floor area (see Figure 1). On top of this, cost inflation since 1992 has been substantial, with replacement costs in Florida estimated to have increased between two times and 2.5 times since 1992, based on historical construction cost indices. Figure 1: Exposure growth in Hurricane Andrew’s footprint (in constant dollars). Source: RMSOne key uncertainty in estimating the losses from a repeat of Hurricane Andrew concerns the impact of claims litigation. “Irma in 2017 was the first significant hurricane to make landfall since the 25 percent roof replacement rule was expanded in 2017 to all buildings across Florida, and it contributed to a significant increase in claims frequency and severity, as roof damage sustained during the storm attracted many roofing contractors, who handed over their exaggerated claims to be pursued by attorneys,” recalls Datin. An estimated US$15 billion has been paid to claimants by insurers in Florida since 2013, driven by assignment of benefits (AOB) cases, where litigation has capitalized on the 25 percent roof replacement rule, with a significant portion of the cost being driven by attorney’s fees on both sides. However, a new law passed by the Florida legislature in May 2022 changed the 25 percent roof replacement rule to exempt roofs “built, repaired, or replaced in compliance with the 2007 Florida Building Code, or any subsequent editions of the Florida Building Code.” “This means that only the damaged portion of the roof on newly built or upgraded roofs needs to be repaired after a damaging wind event instead of the entire roof or roofing system. Most importantly for insurers, the right of the contractor or assignee to obtain compensation for attorney fees – that drives up the cost of claims even further – has been removed,” adds Datin. Muir-Wood adds: “There is further hope for insurers following a recent appeal court ruling in Florida which could provide the blueprint for insurers to successfully argue against contractors in such lawsuits. Here we have at least one factor that is now being brought under control, which has significantly raised the insurance costs of hurricane losses. However, insurers will be watching closely to see if there is any reduction in social inflation because of recent legislative measures.” Can the US$100 Billion Repeat of Andrew be Prevented? Should another Category 5 hurricane make landfall in southeast Florida today, not only will the insured loss be more considerable, but the insurance industry will face major challenges that could severely impact its ability to withstand the event. What can the risk management industry do to mitigate losses? Risk modeling has advanced dramatically. “Insurers need to collect detailed data on their exposures and values and then employ high-resolution modeling alongside all those factors that can affect the ultimate loss, whether from post-event loss amplification or from more resilient construction standards,” says Muir-Wood. The spirit of the industry working together with regulators, similar to post-Andrew, needs to be resurrected. “To help insurance carriers to remain competitive, regulators and legislators have been working with the industry to prevent claims litigation from getting out of control and potentially threatening the viability of hurricane insurance in Florida,” adds Boissonnade. “And legislators also need to keep a close eye on how claims respond to the changes to the 25 percent roof replacement rule, and in measures that reduce the need for litigation, so as to reduce vexatious claims,” he adds. Datin acknowledges the role that risk modelers can play, “The catastrophe modeling community has already helped drive positive change in Florida by demonstrating the impacts of building codes and the effects of AOB-driven claims inflation on modeled risk.” In addition, says Rahnama: “It’s crucial that modeling for hurricane risk takes greater account of the effects of climate change on global warming and sea level rise, and the impact those will ultimately on wind and storm surge in the event of another hurricane like Andrew. Let’s not sleepwalk into another Andrew-type scenario. The insights are there, and the warning signs have flashed – we just need to learn from history.”

RMS HWind Hurricane Forecasting and Response and ExposureIQ: Exposure Management Without the Grind
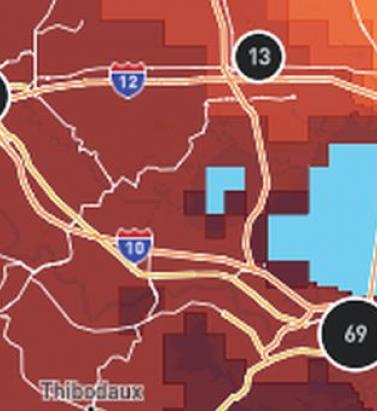
June 19, 2022Accessing data in real-time to assess and manage an insurance carrier’s potential liabilities from a loss event remains the holy grail for exposure management teams and is high on a business’ overall wish list A 2021 PwC Pulse Survey of U.S. risk management leaders found that risk executives are increasingly taking advantage of “tech solutions for real-time and automated processes, including dynamic risk monitoring (30 percent), new risk management tech solutions (25 percent), data analytics (24 percent) [and] integrated risk management tools on a single platform (19 percent)”. PwC suggested that as part of an organization’s wider digital and business transformation process, risk management teams should therefore: “use technologies that work together, draw on common data sources, build enterprise-wide analytics and define common sets of metrics.” Separately, Deloitte’s 2021 third-party risk management (TPRM) survey found that 53 percent of respondents across a range of industry sectors wanted to improve real-time information, risk metrics, and reporting in their organizations. With the pandemic providing the unlikely backdrop for driving innovation across the business world, the Deloitte survey explained the statistic with the suggestion that one impact of COVID-19 “has been a greater need for real-time continuous assessment and alerts, rather than traditional point-in-time third-party assessment.” Event Forecasting and Response with HWind and ExposureIQ Natural catastrophe events are a risk analytics flash point. And while growing board-level awareness of the importance of real-time reporting might seem like a positive, without marrying the data with the right tools to gather and process that data, together with a more integrated approach to risk management and modeling functions, the pain points for exposure managers on the event frontline, are unlikely to be relieved. RMS® ExposureIQ™ is an exposure management application available on the cloud-native RMS Intelligent Risk Platform™, which enables clients to centralize exposure data, process it, write direct reports and then run deterministic scenarios to quickly and accurately assess their exposure. When an event is threatening or impacts risks, an exposure management team needs to rapidly process the available data to work out their overall exposure and the likely effect on insured assets. The integration of event response data such as HWind into the ExposureIQ application is where the acquisition of this hazard data really starts to make a difference. The 2022 North Atlantic hurricane season, for example, is upon us, and access to regular, real-time data is relied upon as a crucial part of event response to tropical cyclones. With reliable event response analytics, updated in real-time, businesses can get fully prepared and ensure solvency through additional reinsurance cover, more accurately reserve funds, and confidently communicate risk to all stakeholders. The National Oceanic and Atmospheric Administration’s (NOAA) National Hurricane Center (NHC) has long been viewed as a valuable resource for forecasts on the expected track and severity of hurricanes. However, according to Callum Higgins, product manager, global climate, at RMS, “There are some limitations with what you get [from the NHC]. Forecasts lack detailed insights into the spatial variability of hazard severity and while uncertainty is accounted for, this is based on historical data rather than the forecast uncertainty specific to the storm. Hurricane Henri in 2021 was a good example of this. While the ultimate landfall location fell outside the NHC ‘cone of uncertainty’ four days in advance of landfall, given the large model uncertainty in the track for Henri, HWind forecasts were able to account for this possibility.” Introducing HWind RMS HWind provides observation-based tropical cyclone data for both real-time and historical events and was originally developed as a data service for the NHC by renowned meteorologist Dr. Mark Powell. It combines the widest set of observations for a particular storm in order to create the most accurate representation of its wind field. Since RMS acquired HWind in 2015, it has continually evolved as a solution that can be leveraged more easily by insurers to benefit individual use cases. HWind provides snapshots (instantaneous views of the storm’s wind field) and cumulative footprints (past swaths of the maximum wind speeds) every six hours. In addition, RMS delivers hurricane forecast data that includes a series of forecast scenarios of both the wind and surge hazard, enabling users to understand the potential severity of the event up to five days in advance of landfall. “Because HWind real-time products are released up to every six hours, you can adapt your response as forecasts shift. After an event has struck you very quickly get a good view of which areas have been impacted and to what level of severity,” explains Higgins. The level of detail is another key differentiator. In contrast to the NHC forecasts, which do not include a detailed wind field, HWind provides much more data granularity, with forecast wind and surge scenarios developed by leveraging the RMS North Atlantic Hurricane Models. Snapshots and cumulative footprints, meanwhile, represent the wind field on a 1x1 kilometer grid. And while the NHC does provide uncertainty metrics in its forecasts, such as the “cone of uncertainty” around where the center of the storm will track, these are typically based on historical statistics. “HWind accounts for the actual level of model convergence for a particular storm. That provides you with the insights you need to make decisions around how much confidence to place in each forecast, including whether a more conservative approach is required in cases of heightened uncertainty,” Higgins explains. HWind’s observational approach and access to more than 30 data sources, some of which are exclusive to RMS, means users are better able to capture a particular wind field and apply that data across a wide variety of use cases. Some HWind clients – most notably, Swiss Re – also use it as a trigger for parametric insurance policies. “That’s a critical component for some of our clients,” says Higgins. “For a parametric trigger, you want to make sure you have as accurate as possible a view of the wind speed experienced at underwritten locations when a hurricane strikes.” Real-time data is only one part of the picture. The HWind Enhanced Archive is a catalog of data – including high-resolution images, snapshots, and footprints from historical hurricanes extending back almost 30 years that can be used to validate historical claims and loss experience. “When we're creating forecasts in real-time, we only have the information of what has come before [in that particular storm],” says Higgins. “With the archive, we can take advantage of the data that comes in after we produce the snapshots and use all of that to produce an enhanced archive to improve what we do in real-time.” Taking the Stress out of Event Response “Event response is quite a stressful time for the insurance industry, because they've got to make business decisions based around what their losses could be,” Higgins adds. “At the time of these live events, there's always increased scrutiny around their exposure and reporting.” HWind has plugged the gap in the market for a tool that can provide earlier, more frequent, and more detailed insights into the potential impact of a hurricane before, during, and following landfall. “The key reason for having HWind available with ExposureIQ is to have it all in one place,” explains Higgins. “There are many different sources of information out there, and during a live event the last thing you want to do is be scrambling across websites trying to see who's released what and then pull it across to your environment, so you can overlay it on your live portfolio of risks. As soon as we release the accumulation footprints, they are uploaded directly into the application, making it faster and more convenient for users to generate an understanding of potential loss for their specific portfolios." RMS applications such as ExposureIQ, and the modeling application Risk Modeler™, all use the same cloud-native Intelligent Risk Platform. This allows for a continuous workflow, allowing users to generate both accumulation analytics as well as modeled losses from the same set of exposure data. During an event, for example, with the seven hurricane scenarios that form part of the HWind data flow, the detailed wind fields and tracks (see Figure below) and the storm surge footprints for each scenario can be viewed on the ExposureIQ application for clients to run accumulations against. The application has a robust integrated mapping service that allows users to view their losses and hot spots on a map, and it also includes the functionality to switch to see the same data distributed in loss tables if that is preferred. “Now that we have both those on view in the cloud, you can overlay the footprint files on top of your exposures, and quickly see it before you even run [the accumulations],” says Higgins. Figure 1: RMS HWind forecast probability of peak gusts greater than 80 miles per hour from Hurricane Ida at 1200UTC August 29, 2021, overlaid on exposure data within the RMS ExposureIQ applicationOne-Stop-Shop This close interaction between HWind and the ExposureIQ application indicates another advantage of the RMS product suite – the use of consistent event response data across the platform so exposure mapping and modeling are all in one place. “The idea is that by having it on the cloud, it is much more performant; you can analyze online portfolios a lot more quickly, and you can get those reports to your board a lot faster than previously,” says Higgins. In contrast to other solutions in the market, which typically use third-party hazard tools and modeling platforms, the RMS suite has a consistent model methodology flowing through the entire product chain. “That's really where the sweet spot of ExposureIQ is – this is all one connected ecosystem,” commented Higgins. “I get my data into ExposureIQ and it is in the same format as Risk Modeler, so I don't need to convert anything. Both products use a consistent financial model too – so you are confident the underlying policy and reinsurance terms are being applied in the same way.” The modular nature of the RMS application ecosystem means that, in addition to hurricane risks, data on perils such as floods, earthquakes, and wildfires are also available – and then processed by the relevant risk modeling tool to give clients insights on their potential losses. “With that indication of where you might expect to experience claims, and how severe those claims might be, you can start to reach out to policyholders to understand if they've been affected.” At this point, clients are then in a good position to start building their claims deployment strategy, preparing claims adjusters to visit impacted sites and briefing reserving and other teams on when to start processing payments. But even before a hurricane has made landfall, clients can make use of forecast wind fields to identify locations that might be affected in advance of the storm and warn policyholders to prepare accordingly. “That can not only help policyholders to protect their property but also mitigate insurance losses as well,” says Higgins. “Similarly, you can use it to apply an underwriting moratorium in advance of a storm. Identify areas that are likely to be impacted, and then feed that into underwriting processes to ensure that no one can write a policy in the region when a storm is approaching.” The First Unified Risk Modeling Platform Previously, before moving to an integrated, cloud-based platform, these tools would likely have been hosted using on-premises servers with all the significant infrastructure costs that implies. Now, in addition to accessing a full suite of products via a single cloud-native platform, RMS clients can also leverage the company’s three decades of modeling expertise, benefiting from a strong foundation of trusted exposure data to help manage their exposures. “A key goal for a lot of people responding to events is initially to understand what locations are affected, how severely they're affected, and what their total exposed limit is, and to inform things like deploying claims adjusters,” says Higgins. And beyond the exposure management function, argues Higgins, it’s about gearing up for the potential pain of those claims, the processes that go around that, and the communication to the board. “These catastrophic events can have a significant impact on a company’s revenue, and the full implications – and any potential mitigation – needs to be well understood.” Find out more about the award-winning ExposureIQ.
