


EXPOSURE
The RMS Magazine with a unique perspective and clear mission “... to provide insight and analysis to help insurance and risk professionals innovate, adapt, and deliver.”

Insurance: The next 10 years
Mohsen Rahnama, Cihan Biyikoglu and Moe Khosravy of RMS look to 2029, consider the…
Times Square, New York City
Reset Filters
Perils
- 2022
- 2021
- 2020
- 2019
- 2018
- 2017
- 2016
Assigning a Return Period to 2017
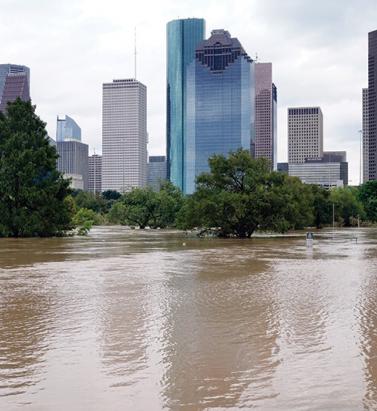
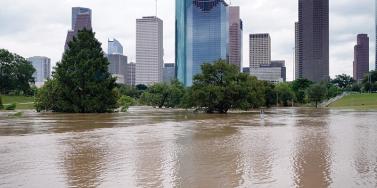
Hurricanes Harvey, Irma and Maria (HIM) tore through the Caribbean and U.S. in 2017, resulting in insured losses over US$80 billion. Twelve years after Hurricanes Katrina, Rita and Wilma (KRW), EXPOSURE asks if the (re)insurance industry was better prepared for its next ‘terrible trio’ and what lessons can be learned In one sense, 2017 was a typical loss year for the insurance industry in that the majority of losses stemmed from the “peak zone” of U.S. hurricanes. However, not since the 2004-05 season had the U.S. witnessed so many landfalling hurricanes. It was the second most costly hurricane season on record for the (re)insurance industry, when losses in 2005 are adjusted for inflation. According to Aon Benfield, HIM caused total losses over US$220 billion and insured losses over US$80 billion — huge sums in the context of global catastrophe losses for the year of US$344 billion and insured losses of US$134 billion. Overall, weather-related catastrophe losses exceeded 0.4 percent of global GDP in 2017 (based on data from Aon Benfield, Munich Re and the World Bank), the second highest figure since 1990. In that period, only 2005 saw a higher relative catastrophe loss at around 0.5 percent of GDP. But, it seems, (re)insurers were much better prepared to absorb major losses this time around. Much has changed in the 12 years since Hurricane Katrina breached the levees in New Orleans. Catastrophe modeling as a profession has evolved into exposure management, models and underlying data have improved and there is a much greater appreciation of model uncertainty and assumptions, explains Alan Godfrey, head of exposure management at Asta. “Even post-2005 people would still see an event occurring, go to the models and pull out a single event ID … then tell all and sundry this is what we’re going to lose. And that’s an enormous misinterpretation of how the models are supposed to be used. In 2017, people demonstrated a much greater maturity and used the models to advise their own loss estimates, and not the other way around.” It also helped that the industry was extremely well-capitalized moving into 2017. After a decade of operating through a low interest rate and increasingly competitive environment, (re)insurers had taken a highly disciplined approach to capital management. Gone are the days where a major event sparked a series of run-offs. While some (re)insurers have reported higher losses than others, all have emerged intact. “In 2017 the industry has performed incredibly well from an operational point of view,” says Godfrey. “There have obviously been challenges from large losses and recovering capital, but those are almost outside of exposure management.” According to Aon Benfield, global reinsurance capacity grew by 80 percent between 1990 and 2017 (to US$605 billion), against global GDP growth of around 24 percent. The influx of capacity from the capital markets into U.S. property catastrophe reinsurance has also brought about change and innovation, offering new instruments such as catastrophe bonds for transferring extreme risks. Harvey broke all U.S. records for tropical cyclone-driven rainfall with observed cumulative rainfall of 51 inches Much of this growth in non-traditional capacity has been facilitated by better data and more sophisticated analytics, along with a healthy appetite for insurance risk from pension funds and other institutional investors. For insurance-linked securities (ILS), the 2017 North Atlantic hurricane season, Mexico’s earthquakes and California’s wildfires were their first big test. “Some thought that once we had a significant year that capital would leave the market,” says John Huff, president and chief executive of the Association of Bermuda Insurers and Reinsurance (ABIR). “And we didn’t see that. “In January 2018 we saw that capital being reloaded,” he continues. “There is abundant capital in all parts of the reinsurance market. Deploying that capital with a reasonable rate of return is, of course, the objective.” Huff thinks the industry performed extremely well in 2017 in spite of the severity of the losses and a few surprises. “I’ve even heard of reinsurers that were ready with claim payments on lower layers before the storm even hit. The modeling and ability to track the weather is getting more sophisticated. We saw some shifting of the storms — Irma was the best example — but reinsurers were tracking that in real time in order to be able to respond.” The Buffalo Bayou River floods a park in Houston after the arrival of Hurricane Harvey How Harvey Inundated Houston One lesson the industry has learned over three decades of modeling is that models are approximations of reality. Each event has its own unique characteristics, some of which fall outside of what is anticipated by the models. The widespread inland flooding that occurred after Hurricane Harvey made landfall on the Texas coastline is an important illustration of this, explains Huff. Even so, he adds, it continued a theme, with flood losses being a major driver of U.S. catastrophe claims for several years now. “What we’re seeing is flood events becoming the No. 1 natural disaster in the U.S. for people who never thought they were at risk of flood.” Harvey broke all U.S. records for tropical cyclone-driven rainfall with observed cumulative rainfall of 51 inches (129 centimeters). The extreme rainfall generated by Harvey and the unprecedented inland flooding across southeastern Texas and parts of southern Louisiana was unusual. However, nobody was overly surprised by the fact that losses from Harvey were largely driven by water versus wind. Prior events with significant storm surge-induced flooding, including Hurricane Katrina and 2012’s Superstorm Sandy, had helped to prepare (re)insurers, exposure managers and modelers for this eventuality. “The events themselves were very large but they were well within uncertainty ranges and not disproportionate to expectations,” says Godfrey. “Harvey is a new data point — and we don’t have that many — so the scientists will look at it and know that any new data point will lead to tweaks,” he continues. “If anything, it will make people spend a bit more time on their calibration for the non-modeled elements of hurricane losses, and some may conclude that big changes are needed to their own adjustments.” But, he adds: “Nobody is surprised by the fact that flooding post-hurricane causes loss. We know that now. It’s more a case of tweaking and calibrating, which we will be doing for the rest of our lives.” Flood Modeling Hurricane Harvey also underscored the importance of the investment in sophisticated, probabilistic flood models. RMS ran its U.S. Inland Flood HD Model in real time to estimate expected flood losses. “When Hurricane Harvey happened, we had already simulated losses of that magnitude in our flood model, even before the event occurred,” says Dr. Pete Dailey, vice president of product management and responsible for U.S. flood modeling at RMS. “The value of the model is to be able to anticipate extreme tail events well before they occur, so that insurance companies can be prepared in advance for the kind of risk they’re taking on and what potential claims volume they may have after a major event,” he adds. Does this mean that a US$100 billion-plus loss year like 2017 is now a 1-in-6-year event? Harvey has already offered a wealth of new data that will be fed into the flood model. The emergency shutdown of the Houston metropolitan area prevented RMS meteorologists and engineers from accessing the scene in the immediate aftermath, explains Dailey. However, once on the ground they gathered as much information as they could, observing and recording what had actually happened to affected properties. “We go to individual properties to assess the damage visually, record the latitude and longitude of the property, the street address, the construction, occupancy and the number of stories,” he says. “We will also make an estimate of the age of the property. Those basic parameters allow us to go back and take a look at what the model would have predicted in terms of damage and loss, as compared to what we observed.” The fact that insured losses emanating from the flooding were only a fraction of the total economic losses is an inevitable discussion point. The majority of claims paid were for commercial properties, with residential properties falling under the remit of the National Flood Insurance Program (NFIP). Many residential homes were uninsured, however, explains ABIR’s Huff. “The NFIP covers just the smallest amount of people — there are only five million policies — and yet you see a substantial event like Harvey which is largely uninsured because (re)insurance companies only cover commercial flood in the U.S.,” he says. “After Harvey you’ll see a realization that the private market is very well-equipped to get back into the private flood business, and there’s a national dialogue going on now.” Is 2017 the New Normal? One question being asked in the aftermath of the 2017 hurricane season is: What is the return period for a loss year like 2017? RMS estimates that, in terms of U.S. and Caribbean industry insured wind, storm surge and flood losses, the 2017 hurricane season corresponds to a return period between 15 and 30 years. However, losses on the scale of 2017 occur more frequently when considering global perils. Adjusted for inflation, it is seven years since the industry paid out a similar level of catastrophe claims — US$110 billion on the Tohoku earthquake and tsunami, Thai floods and New Zealand earthquake in 2011. Six years prior to that, KRW cost the industry in excess of US$75 billion (well over US$100 billion in today’s money). So, does this mean that a US$100 billion-plus (or equivalent in inflation-adjusted terms) loss year like 2017 is now a one-in-six-year event? As wealth and insurance penetration grows in developing parts of the world, will we begin to see more loss years like 2011, where catastrophe claims are not necessarily driven by the U.S. or Japan peak zones? “Increased insurance penetration does mean that on the whole losses will increase, but hopefully this is proportional to the premiums and capital that we are getting in,” says Asta’s Godfray. “The important thing is understanding correlations and how diversification actually works and making sure that is applied within business models. “In the past, people were able to get away with focusing on the world in a relatively binary fashion,” he continues. “The more people move toward diversified books of business, which is excellent for efficient use of capital, the more important it becomes to understand the correlations between different regions.” “You could imagine in the future, a (re)insurer making a mistake with a very sophisticated set of catastrophe and actuarial models,” he adds. “They may perfectly take into account all of the non-modeled elements but get the correlations between them all wrong, ending up with another year like 2011 where the losses across the globe are evenly split, affecting them far more than their models had predicted.” As macro trends including population growth, increasing wealth, climate change and urbanization influence likely losses from natural catastrophes, could this mean a shorter return period for years like last year, where industry losses exceeded US$134 billion? “When we look at the average value of properties along the U.S. coastline — the Gulf Coast and East Coast — there’s a noticeable trend of increasing value at risk,” says Dailey. “That is because people are building in places that are at risk of wind damage from hurricanes and coastal flooding. And these properties are of a higher value because they are more complex, have a larger square footage and have more stories. Which all leads to a higher total insured value. “The second trend that we see would be from climate change whereby the storms that produce damage along the coastline may be increasing in frequency and intensity,” he continues. “That’s a more difficult question to get a handle on but there’s a building consensus that while the frequency of hurricane landfalls may not necessarily be increasing, those that do make landfall are increasing in intensity.” Lloyd’s chief executive Inga Beale has stated her concerns about the impact of climate change, following the market’s £4.5 billion catastrophe claims bill for 2017. “That’s a significant number, more than double 2016; we’re seeing the impact of climate change to a certain extent, particularly on these weather losses, with the rising sea level that impacts and increases the amount of loss,” she said in an interview with Bloomberg. While a warming climate is expected to have significant implications for the level of losses arising from storms and other severe weather events, it is not yet clear exactly how this will manifest, according to Tom Sabbatelli, senior product manager at RMS. “We know the waters have risen several centimeters in the last couple of decades and we can use catastrophe models to quantify what sort of impact that has on coastal flooding, but it’s also unclear what that necessarily means for tropical cyclone strength. “The oceans may be warming, but there’s still an ongoing debate about how that translates into cyclone intensity, and that’s been going on for a long time,” he continues. “The reason for that is we just don’t know until we have the benefit of hindsight. We haven’t had a number of major hurricanes in the last few years, so does that mean that the current climate is quiet in the Atlantic? Is 2017 an anomaly or are we going back to more regular severe activity? It’s not until you’re ten or 20 years down the line and you look back that you know for sure.”


Brazil: Modeling the World's Future Breadbasket
How a crop modeling collaboration with IRB Brasil Re could help bridge the protection gap and build a more resilient agricultural base for the future in Brazil Brazil is currently the world’s second largest corn exporter, and is set to overtake the U.S. as the globe’s biggest soybean exporter, with the U.S. Department of Agriculture (USDA) predicting a record Brazilian soybean crop of 115 million metric tons in its outlook for 2018. Yet this agricultural powerhouse — responsible for around a quarter of Brazil’s GDP — remains largely underinsured, according to Victor Roldán, vice president and head of Caribbean and Latin America at RMS. A situation that must be addressed given the importance of the sector for the country’s economy and growing weather extremes farmers must contend with under climate change conditions. The effects of climate change over the next 25 years could lead to further heavy crop losses “Natural perils are identified as the industry’s main risk,” he says. “Major droughts or excess of rain have been big drivers of losses for the sector, and their frequency and severity shall increase under future climate change conditions. During 2014 to 2017, El Niño affected Brazil with some of the largest droughts in some areas of the country and excess of rain in others. “There is a need to structure more effective and attractive insurance products to protect the farmers,” he continues. “For this we need better analytics, a better understanding of the perils, exposure and vulnerability.” Worst Drought in 80 Years The worst drought in 80 years reached its height in 2015, with farmers in Sao Paulo losing up to a third of their crops due to the dry weather. Production of soy shrank by 17 percent between 2013 and 2014 while around a fifth of the state’s citrus crops died. Meanwhile, heavy rain and flash floods in the south of the country also detrimentally impacted agricultural output. The effects of climate change over the next 25 years could lead to further heavy crop losses, according to a study carried out by Brazil’s Secretariat of Strategic Issues (SAE). It found that some of the country’s main crops could suffer a serious decline in the areas already under cultivation, anticipating a decline of up to 39 percent in the soybean crop. This could translate into significant financial losses, since the soybean crop currently brings in around US$20 billion in export earnings annually. IRB Brasil Re has been the leader in the agricultural reinsurance sector of the country for decades and has more than 70 years of agricultural claims data. Today agricultural risks represent its second-largest business line after property. However, insurance penetration remains low in the agricultural sector, and IRB has been seeking ways in which to encourage take-up among farmers. The 2015 drought was a turning point, explains Roldán. “As the largest reinsurance player in Brazil, IRB needed to address in a more systematic way the recorded 16.3 percent increase in claims. The increase was due to the drought in the Midwestern region, which adversely affected corn, soybean and coffee crops and, separately an increase in the historical average rainfall level in the Southern region, which caused damage to the crops.” Building a Probabilistic Crop Model A better crop-weather modeling approach and risk analytics of crop perils will help the market to better understand their risks and drive growth in crop insurance penetration. IRB is partnering with RMS to develop the first fully probabilistic hybrid crop model for the agricultural insurance sector in Brazil, which it is planning to roll out to its cedants. The model will assess crop risks linked with weather drivers, such as drought, excess rainfall, temperature variation, hail events, strong wind and other natural hazards that impact crop yield variability. The model will be suited for different crop insurance products such as named perils (hail, frost, etc.), Multiple-Peril Crop Insurance (MPCI) and revenue covers, and will also include livestock and forestry. “Major droughts or excess of rain have been big drivers of losses for the sector, but also climate change is a worrying trend” Victor Roldán RMS “Weather-driven impacts on crop production are complex perils to model given the natural variability in space and time, the localized nature of the hazards and the complex vulnerability response depending on the intensity, but also on the timing of occurrence,” explains Olivier Bode, manager, global agricultural risk at RMS. “For instance, plant vulnerability not only depends on the intensity of the stress but also on the timing of the occurrence, and the crop phenology or growth stage, which in turn depends on the planting date and the selected variety along with the local weather and soil conditions,” he continues. “Thus, exposure information is critical as you need to know which variety the farmer is selecting and its corresponding planting date to make sure you’re representing correctly the impacts that might occur during a growing season. The hybrid crop model developed by RMS for IRB has explicit modules that account for variety specific responses and dynamic representation of crop growth stages.” The model will rely on more than historical data. “That’s the major advantage of using a probabilistic crop-weather modeling approach,” says Bode. “Typically, insurers are looking at historical yield data to compute actuarial losses and they don’t go beyond that. A probabilistic framework allows insurers to go beyond the short historical yield record, adding value by coupling longer weather time series with crop models. They also allow you to capture future possible events that are not recorded in past weather data, for example, drought events that might span over several years, flood occurrences extending over larger or new areas as well as climate change related impacts. This allows you to calculate exceedance probability losses at different return periods for each crop and for specific scenarios.” There is also significant potential to roll out the model to other geographies in the future, with Colombia currently looking like the obvious next step and opportunity. “The El Niño weather phenomenon affects all of Latin America; it decreases rains by more than 60 percent during the rainy seasons in many countries,” explains Roldán. “Like Brazil, Colombia is a very biologically diverse country and features a variety of ecosystems. Currently, most of the country has under-utilized agricultural land.” Colombia is already a key player worldwide in two products: coffee and cut flowers. But the country signed a number of free trade agreements that will give its producers more access to foreign markets. “So, the expansion of agribusiness insurance is urgently needed in Colombia,” says Roldán.

Getting Wildfire Under Control
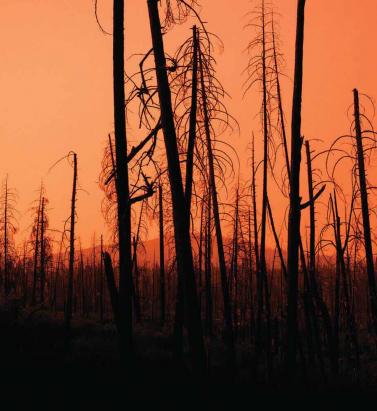
The extreme conditions of 2017 demonstrated the need for much greater data resolution on wildfire in North America The 2017 California wildfire season was record-breaking on virtually every front. Some 1.25 million acres were torched by over 9,000 wildfire events during the period, with October to December seeing some of the most devastating fires ever recorded in the region*. From an insurance perspective, according to the California Department of Insurance, as of January 31, 2018, insurers had received almost 45,000 claims relating to losses in the region of US$11.8 billion. These losses included damage or total loss to over 30,000 homes and 4,300 businesses. On a countrywide level, the total was over 66,000 wildfires that burned some 9.8 million acres across North America, according to the National Interagency Fire Center. This compares to 2016 when there were 65,575 wildfires and 5.4 million acres burned. Caught off Guard “2017 took us by surprise,” says Tania Schoennagel, research scientist at the University of Colorado, Boulder. “Unlike conditions now [March 2018], 2017 winter and early spring were moist with decent snowpack and no significant drought recorded.” Yet despite seemingly benign conditions, it rapidly became the third-largest wildfire year since 1960, she explains. “This was primarily due to rapid warming and drying in the late spring and summer of 2017, with parts of the West witnessing some of the driest and warmest periods on record during the summer and remarkably into the late fall. “Additionally, moist conditions in early spring promoted build-up of fine fuels which burn more easily when hot and dry,” continues Schoennagel. “This combination rapidly set up conditions conducive to burning that continued longer than usual, making for a big fire year.” While Southern California has experienced major wildfire activity in recent years, until 2017 Northern California had only experienced “minor-to-moderate” events, according to Mark Bove, research meteorologist, risk accumulation, Munich Reinsurance America, Inc. “In fact, the region had not seen a major, damaging fire outbreak since the Oakland Hills firestorm in 1991, a US$1.7 billion loss at the time,” he explains. “Since then, large damaging fires have repeatedly scorched parts of Southern California, and as a result much of the industry has focused on wildfire risk in that region due to the higher frequency and due to the severity of recent events. “Although the frequency of large, damaging fires may be lower in Northern California than in the southern half of the state,” he adds, “the Wine Country fires vividly illustrated not only that extreme loss events are possible in both locales, but that loss magnitudes can be larger in Northern California. A US$11 billion wildfire loss in Napa and Sonoma counties may not have been on the radar screen for the insurance industry prior to 2017, but such losses are now.” Smoke on the Horizon Looking ahead, it seems increasingly likely that such events will grow in severity and frequency as climate-related conditions create drier, more fire-conducive environments in North America. “Since 1985, more than 50 percent of the increase in the area burned by wildfire in the forests of the Western U.S. has been attributed to anthropogenic climate change,” states Schoennagel. “Further warming is expected, in the range of 2 to 4 degrees Fahrenheit in the next few decades, which will spark ever more wildfires, perhaps beyond the ability of many Western communities to cope.” “Climate change is causing California and the American Southwest to be warmer and drier, leading to an expansion of the fire season in the region,” says Bove. “In addition, warmer temperatures increase the rate of evapotranspiration in plants and evaporation of soil moisture. This means that drought conditions return to California faster today than in the past, increasing the fire risk.” “Even though there is data on thousands of historical fires … it is of insufficient quantity and resolution to reliably determine the frequency of fires” Mark Bove Munich Reinsurance America While he believes there is still a degree of uncertainty as to whether the frequency and severity of wildfires in North America has actually changed over the past few decades, there is no doubt that exposure levels are increasing and will continue to do so. “The risk of a wildfire impacting a densely populated area has increased dramatically,” states Bove. “Most of the increase in wildfire risk comes from socioeconomic factors, like the continued development of residential communities along the wildland-urban interface and the increasing value and quantity of both real estate and personal property.” Breaches in the Data Yet while the threat of wildfire is increasing, the ability to accurately quantify that increased exposure potential is limited by a lack of granular historical data, both on a countrywide basis and even in highly exposed fire regions such as California, to accurately determine the probability of an event occurring. “Even though there is data on thousands of historical fires over the past half-century,” says Bove, “it is of insufficient quantity and resolution to reliably determine the frequency of fires at all locations across the U.S. “This is particularly true in states and regions where wildfires are less common, but still holds true in high-risk states like California,” he continues. “This lack of data, as well as the fact that the wildfire risk can be dramatically different on the opposite ends of a city, postcode or even a single street, makes it difficult to determine risk-adequate rates.” According to Max Moritz, Cooperative Extension specialist in fire at the University of California, current approaches to fire mapping and modeling are also based too much on fire-specific data. “A lot of the risk data we have comes from a bottom-up view of the fire risk itself. Methodologies are usually based on the Rothermel Fire Spread equation, which looks at spread rates, flame length, heat release, et cetera. But often we’re ignoring critical data such as wind patterns, ignition loads, vulnerability characteristics, spatial relationships, as well as longer-term climate patterns, the length of the fire season and the emergence of fire-weather corridors.” Ground-level data is also lacking, he believes. “Without very localized data you’re not factoring in things like the unique landscape characteristics of particular areas that can make them less prone to fire risk even in high-risk areas.” Further, data on mitigation measures at the individual community and property level is in short supply. “Currently, (re)insurers commonly receive data around the construction, occupancy and age of a given risk,” explains Bove, “information that is critical for the assessment of a wind or earthquake risk.” However, the information needed to properly assess wildfire risk is typically not captured. For example, whether roof covering or siding is combustible. Bove says it is important to know if soffits and vents are open-air or protected by a metal covering, for instance. “Information about a home’s upkeep and surrounding environment is critical as well,” he adds. At Ground Level While wildfire may not be as data intensive as a peril such as flood, it is almost as demanding, especially on computational capacity. It requires simulating stochastic or scenario events all the way from ignition through to spread, creating realistic footprints that can capture what the risk is and the physical mechanisms that contribute to its spread into populated environments. The RMS®North America Wildfire HD Model capitalize on this expanded computational capacity and improved data sets to bring probabilistic capabilities to bear on the peril for the first time across the entirety of the contiguous U.S. and Canada. Using a high-resolution simulation grid, the model provides a clear understanding of factors such as the vegetation levels, the density of buildings, the vulnerability of individual structures and the extent of defensible space. The model also utilizes weather data based on re-analysis of historical weather observations to create a distribution of conditions from which to simulate stochastic years. That means that for a given location, the model can generate a weather time series that includes wind speed and direction, temperature, moisture levels, et cetera. As wildfire risk is set to increase in frequency and severity due to a number of factors ranging from climate change to expansions of the wildland-urban interface caused by urban development in fire-prone areas, the industry now has to be able to live with that and understand how it alters the risk landscape. On the Wind Embers have long been recognized as a key factor in fire spread, either advancing the main burn or igniting spot fires some distance from the originating source. Yet despite this, current wildfire models do not effectively factor in ember travel, according to Max Moritz, from the University of California. “Post-fire studies show that the vast majority of buildings in the U.S. burn from the inside out due to embers entering the property through exposed vents and other entry points,” he says. “However, most of the fire spread models available today struggle to precisely recreate the fire parameters and are ineffective at modeling ember travel.” During the Tubbs Fire, the most destructive wildfire event in California’s history, embers carried on extreme ‘Diablo’ winds sparked ignitions up to two kilometers from the flame front. The rapid transport of embers not only created a more fast-moving fire, with Tubbs covering some 30 to 40 kilometers within hours of initial ignition, but also sparked devastating ignitions in areas believed to be at zero risk of fire, such as Coffey Park, Santa Rosa. This highly built-up area experienced an urban conflagration due to ember-fueled ignitions. “Embers can fly long distances and ignite fires far away from its source,” explains Markus Steuer, consultant, corporate underwriting at Munich Re. “In the case of the Tubbs Fire they jumped over a freeway and ignited the fire in Coffey Park, where more than 1,000 homes were destroyed. This spot fire was not connected to the main fire. In risk models or hazard maps this has to be considered. Firebrands can fly over natural or man-made fire breaks and damage can occur at some distance away from the densely vegetated areas.” For the first time, the RMS North America Wildfire HD Model enables the explicit simulation of ember transport and accumulation, allowing users to detail the impact of embers beyond the fire perimeters. The simulation capabilities extend beyond the traditional fuel-based fire simulations, and enable users to capture the extent to which large accumulations of firebrands and embers can be lofted beyond the perimeters of the fire itself and spark ignitions in dense residential and commercial areas. As was shown in the Tubbs Fire, areas not previously considered at threat of wildfire were exposed by the ember transport. The introduction of ember simulation capability allows the industry to quantify the complete wildfire risk appropriately across North America wildfire portfolios.
Where Tsunami Warnings Are Etched in Stone
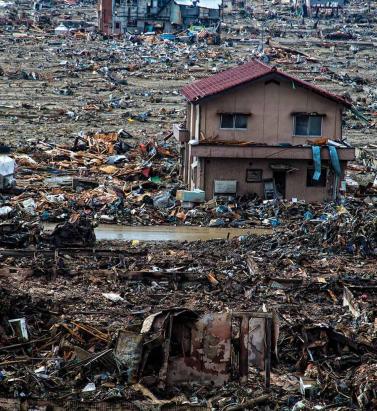
EXPOSURE looks back at the 2011 Tohoku event and other significant events that have shaped scientific knowledge and understanding of earthquake risk incorporated into the RMS® Japan Earthquake and Tsunami HD Model Hundreds of ancient markers dot the coastline of Japan, some over 600 years old, as a reminder of the danger of tsunami. Today, a new project to construct a 12.5-meter-high seawall stretching nearly 400 kilometers along Japan’s northeast coast is another reminder. Japan is a highly seismically active country and was well prepared for earthquakes and tsunami ahead of the Tohoku Earthquake in 2011. It had strict building codes, protective tsunami barriers, early-warning systems and disaster-response plans. But it was the sheer magnitude, scale and devastation caused by the Tohoku Earthquake and Tsunami that made it stand out from the many thousands of earthquakes that had come before it in modern times. What had not been foreseen in government planning was that an earthquake of this magnitude could occur, nor that it could produce such a sizable tsunami. The Tohoku Earthquake was a magnitude 9.0 event — off the charts as far as the Japanese historical record for earthquakes was concerned. A violent change in the ocean bottom triggered an immense tsunami with waves of up to 40 meters that tore across the northeast coast of the main island of Honshu, traveling up to 10 kilometers inland in the Sendai area. The tsunami breached sea walls and claimed almost everything in its path, taking 16,000 lives (a further 2,000 remain missing, presumed dead) and causing economic losses of US$235 billion. However, while the historical record proved inadequate preparation for the Tohoku event, the geological record shows that events of that magnitude had occurred before records began, explains Mohsen Rahnama, chief risk modeling officer at RMS. “Since the Tohoku event, there’s been a shift … to moving further back in time using a more full consideration of the geological record” Mohsen Rahnama RMS “If you go back in the geological record to 869 in the Tohoku region, there is evidence for a potentially similarly scaled tsunami,” he explains. “Since the Tohoku event, there’s been a shift in the government assessments moving away from a focus on what happened historically to a more full consideration of the geological record.” The geological record, which includes tsunami deposits in coastal lakes and across the Sendai and Ishinomaki plains, shows there were large earthquakes and associated tsunami in A.D. 869, 1611 and 1896. The findings of this research point to the importance of having a fully probabilistic tsunami model at a very high resolution. Rahnama continues: “The Tohoku event really was the ‘perfect’ tsunami hitting the largest exposure concentration at risk to tsunami in Japan. The new RMS tsunami model for Japan includes tsunami events similar to and in a few cases larger than were observed in 2011. Because the exposure in the region is still being rebuilt, the model cannot produce tsunami events with this scale of loss in Tohoku at this time.” Incorporating Secondary Perils RMS has incorporated the lessons from the Tohoku Earthquake and other major earthquakes that have occurred within its model. There have been several large earthquakes around the world, and they all inform thinking about the largest events, particularly how the ground motions they produce are modeled. Crucially, it includes a fully probabilistic tsunami model that is integrated with the earthquake stochastic event set. On understanding strong ground shaking, information across events is utilized. For example, petrochemical facilities around the world are built with relatively consistent construction practices. This means that examination of the damage experienced by these types of facilities in Chile and Japan can inform the understanding of the performance of these facilities in other parts of the world with similar seismic hazard. The Maule Earthquake in Chile in 2010, the Canterbury sequence of earthquakes in New Zealand in 2010 and 2011, and the more recent Kumamoto Earthquakes in Japan in 2016, have added considerably to the data sets. Most notably they have informed scientific understanding of the nature of secondary earthquake perils, including tsunami, fire following earthquake, landslides and liquefaction. The 2016 Kumamoto Earthquake sequence triggered extensive landsliding. The sequence included five events in the range of magnitude 5.5 to 7.0 and caused severe damage in Kumamoto and Oita Prefectures from ground shaking, landsliding, liquefaction and fire following earthquake. “Liquefaction is in the model as a secondary peril. RMS has redesigned and recalibrated the liquefaction model for Japan. The new model directly calculates damage due to vertical deformation due to liquefaction processes,” says Chesley Williams, senior director, product management at RMS. “While the 1964 Niigata Earthquake with its tipped apartment buildings showed that liquefaction damages can be severe in Japan, on a countrywide basis the earthquake risk is driven by the shaking, tsunami and fire following, followed by liquefaction and landslide. For individual exposures, the key driver of the earthquake risk is very site specific, highlighting the importance of high-resolution modeling in Japan.” The RMS model accounts for the clustering of large events on the Nankai Trough. This is an important advancement as an examination of the historical record shows that events on the Nankai Trough have either occurred as full rupturing events (e.g., 1707 Hoei Earthquake) or as pairs of events (e.g., 1944 and 1946 and two events in 1854). This is different from aftershocks, explains Williams. “Clustered events are events on different sources that would have happened in the long-term earthquake record, and the occurrence of one event impacts the timing of the other events. This is a subtle but important distinction. We can model event clustering on the Nankai Trough due to the comprehensive event record informed by both historical events and the geologic record.” The Tohoku event resulted in insurance losses of US$30 billion to US$40 billion, the costliest earthquake event for the insurance industry in history. While the news media focused on the extreme tsunami, the largest proportion of the insurance claims emanated from damage wrought by the strong ground shaking. Interestingly, likely due to cultural constraints, only a relatively low amount of post-event loss amplification was observed. “In general for very large catastrophes, claims costs can exceed the normal cost of settlement due to a unique set of economic, social and operational factors,” says Williams. “Materials and labor become more expensive and claims leakage can be more of an issue, so there are a number of factors that kick in that are captured by the RMS post-event loss amplification modeling. The Japan model explicitly models post-event loss amplification but limits the impacts to be consistent with the observations in recent events in Japan.” Supply chain disruption and contingent business interruption were significant sources of loss following the Tohoku event. This was exacerbated by the level seven meltdown at the Fukushima nuclear power plant that resulted in evacuations, exclusion zones and rolling blackouts. “We sent reconnaissance teams to Japan after the event to understand the characteristics of damage and to undertake case studies for business interruption,” says Williams. “We visited large industrial facilities and talked to them about their downtime, their material requirement and their access to energy sources to better understand what had impacted their ability to get back up and running.” Recent events have re-emphasized that there are significant differences in business interruption by occupancy. “For example, a semiconductor facility is likely going to have a longer downtime than a cement factory,” says Williams. “The recent events have highlighted the impacts on business interruption for certain occupancies by damage to supply sources. These contingent business interruptions are complex, so examination of the case studies investigated in Japan were instrumental for informing the model.” Rebuilding in the seven years since the Tohoku Tsunami struck has been an exercise in resilient infrastructure. With nearly half a million people left homeless, there has been intense rebuilding to restore services, industry and residential property. US$12 billion has been spent on seawalls alone, replacing the 4-meter breakwaters with 12.5-meter-high tsunami barriers. An endless convoy of trucks has been moving topsoil from the hills to the coastline in order to raise the land by over 10 meters in places. Most cities have decided to elevate by several meters, with a focus on rebuilding commercial premises in exposed areas. Some towns have forbidden the construction of homes in flat areas nearest the coasts and relocated residents to higher ground. Tokyo-Yokohama: The World’s Most Exposed Metropolis The Japanese metropolis of Tokyo-Yokohama has the world’s greatest GDP at risk from natural catastrophes. Home to 38 million residents, it has potential for significant economic losses from multiple perils, but particularly earthquakes. According to Swiss Re it is the riskiest metropolitan area in the world. A combination of strict building codes, land use plans and disaster preparedness have significantly reduced the city’s vulnerability in recent decades. Despite the devastation caused by the tsunami, very few casualties (around 100) related to partial or complete building collapse resulting from ground shaking during the magnitude 9.0 Tohoku Earthquake.


A Burgeoning Opportunity
As traditional (re)insurers hunt for opportunity outside of property catastrophe classes, new probabilistic casualty catastrophe models are becoming available. At the same time, as catastrophe risks are becoming increasingly “manufactured” or human-made, so casualty classes have the potential to be the source of claims after a large “natural” catastrophe. Just as the growing sophistication of property catastrophe models has enabled industry innovation, there is growing excitement that new tools available to casualty (re)insurers could help to expand the market. By improved evaluation of casualty clash exposures, reinsurers will be better able to understand, price and manage their exposures, as well as design new products that cater to underserved areas. However, the casualty market must switch from pursuing a purely defensive strategy. “There is an ever-growing list of exclusions in liability insurance and interest in the product is declining with the proliferation of these exclusions,” explains Dr. Robert Reville, president and CEO of Praedicat, the world’s first liability catastrophe modeling company. “There is a real growth opportunity for the industry to deal with these exclusions and recognize where they can confidently write more business. “Industry practitioners look at what’s happened in property — where modeling has led to a lot of new product ideas, including capital market solutions, and a lot of innovation — and casualty insurers are hungry for that sort of innovation, for the same sort of transformation in liability that happened in property,” he adds. Perils — particularly emerging risks that underwriters have struggled to price, manage and understand — have typically been excluded from casualty products. This includes electromagnetic fields (EMFs), such as those emanating from broadcast antennas and cell phones. Cover for such exposures is restricted, particularly for the U.S. market, where it is often excluded entirely. Some carriers will not offer any cover at all if the client has even a remote exposure to EMF risks. Yet are they being over-apprehensive about the risk? The fear that leads to an over application of exclusions is very tangible. “The latency of the disease development process — or the way a product might be used, with more people becoming exposed over time — causes there to be a build-up of risk that may result in catastrophe,” Reville continues. “Insurers want to be relevant to insuring innovation in product, but they have to come to terms with the latency and the potential for a liability catastrophe that might emerge from it.” Unique Nature of Casualty Catastrophe It is a misconception that casualty is not a catastrophe class of business. Reville points out that the industry’s US$100 billion-plus loss relating to asbestos claims is arguably its biggest-ever catastrophe. Within the Lloyd’s market the overwhelming nature of APH (asbestos, pollution and health) liabilities contributed to the market’s downward spiral in the late 1980s, only brought under control through the formation of the run-off entity Equitas, now owned and managed by Warren Buffett’s Berkshire Hathaway. As the APH claims crisis demonstrated, casualty catastrophes differ from property catastrophes in that they are a “two-tailed loss.” There is the “tail loss” both have in common, which describes the high frequency, low probability characteristics — or high return period — of a major event. But in addition, casualty classes of business are “long-tail” in nature. This means that a policy written in 2017 may not experience a claim until 20 years later, providing an additional challenge from a modeling and reserving perspective. “Casualty insurers are hungry for that sort of innovation, for the same sort of transformation in liability that happened in property” Robert Reville Praedicat Another big difference between casualty clash and property catastrophe from a modeling perspective is that the past is not a good indication of future claims. “By the time asbestos litigation had really taken off, it was already a banned product in the U.S., so it was not as though asbestos claims were any use in trying to figure out where the next environmental disaster or next product liability was going to be,” says Reville. “So, we needed a forward-looking approach to identify where there could be new sources of litigation.” With the world becoming both more interconnected and more litigious, there is every expectation that future casualty catastrophe losses could be much greater and impact multiple classes of business. “The reality is there’s serial aggregation and systemic risk within casualty business, and our answer to that has generally been that it’s too difficult to quantify,” says Nancy Bewlay, chief underwriting officer, global casualty, at XL Catlin. “But the world is changing. We now have technology advances and data collection capabilities we never had before, and public information that can be used in the underwriting process. “Take the Takata airbag recall,” she continues. “In 2016, they had to recall 100 million airbags worldwide. It affected all the major motor manufacturers, who then faced the accumulation potential not only of third-party liability claims, but also product liability and product recall. Everything starts to accumulate and combine within that one industry, and when you look at the economic footprint of that throughout the supply chain there’s a massive potential for a casualty catastrophe when you see how everything is interconnected.” RMS chief research officer Robert Muir-Wood explains: “Another area where we can expect an expansion of modeling applications concerns casualty lines picking up losses from more conventional property catastrophes. This could occur when the cause of a catastrophe can be argued to have ‘non-natural’ origins, and particularly where there are secondary ‘cascade’ consequences of a catastrophe — such as a dam failing after a big earthquake or for claims on ‘professional lines’ coverages of builders and architects — once it is clear that standard property insurance lines will not compensate for all the building damage.” “This could be prevalent in regions with low property catastrophe insurance penetration, such as in California, where just one in ten homeowners has earthquake cover. In the largest catastrophes, we could expect claims to be made against a wide range of casualty lines. The big innovation around property catastrophe in particular was to employ high-resolution GIS [geographic information systems] data to identify the location of all the risk. We need to apply similar location data to casualty coverages, so that we can estimate the combined consequences of a property/casualty clash catastrophe.” One active instance, cited by Muir-Wood, of this shift from property to casualty cover- ages concerns earthquakes in Oklahoma. “There are large amounts of wastewater left over from fracking, and the cheapest way of disposing of it is to pump it down deep boreholes. But this process has been triggering earthquakes, and these earthquakes have started getting quite big — the largest so far in September 2016 had a magnitude of M5.8. “At present the damage to buildings caused by these earthquakes is being picked up by property insurers,” he continues. “But what you will see over time are lawsuits to try and pass the costs back to the operators of the wells themselves. Working with Praedicat, RMS has done some modeling work on how these operators can assess the risk cost of adding a new disposal well. Clearly the larger the earthquake, the less likely it is to occur. However, the costs add up: our modeling shows that an earthquake bigger than M6 right under Oklahoma City could cause more than US$10 billion of damage.” Muir-Wood adds: “The challenge is that casualty insurance tends to cover many potential sources of liability in the contract and the operators of the wells, and we believe their insurers are not currently identifying this particular — and potentially catastrophic —source of future claims. There’s the potential for a really big loss that would eventually fall onto the liability writers of these deep wells … and they are not currently pricing for this risk, or managing their portfolios of casualty lines.” A Modeled Class of Business According to Reville, the explosion of data and development of data science tools have been key to the development of casualty catastrophe modeling. The opportunity to develop probabilistic modeling for casualty classes of business was born in the mid-2000s when Reville was senior economist at the RAND Corporation. At that time, RAND was using data from the RMS® Probabilistic Terrorism Model to help inform the U.S. Congress in its decision on the renewal of the Terrorism Risk Insurance Act (TRIA). Separately, it had written a paper on the scope and scale of asbestos litigation and its potential future course. “As we were working on these two things it occurred to us that here was this US$100 billion loss — this asbestos problem — and adjacently within property catastrophe insurance there was this developed form of analytics that was helping insurers solve a similar problem. So, we decided to work together to try and figure out if there was a way of solving the problem on the liability side as well,” adds Reville. Eventually Praedicat was spun out of the initial project as its own brand, launching its first probabilistic liability catastrophe model in summer 2016. “The industry has evolved a lot over the past five years, in part driven by Solvency II and heightened interest from the regulators and rating agencies,” says Reville. “There is a greater level of concern around the issue, and the ability to apply technologies to understand risk in new ways has evolved a lot.” There are obvious benefits to (re)insurers from a pricing and exposure management perspective. “The opportunity is changing the way we underwrite,” says Bewlay. “Historically, we underwrote by exclusion with a view to limiting our maximum loss potential. We couldn’t get a clear understanding of our portfolio because we weren’t able to. We didn’t have enough meaningful, statistical and credible data.” “We feel they are not being proactive enough because … there’s the potential for a really big loss that would fall onto the liability writers of these deep wells” Robert Muir-Wood RMS Then there are the exciting opportunities for growth in a market where there is intense competition and downward pressure on rates. “Now you can take a view on the ‘what-if’ scenario and ask: how much loss can I handle and what’s the probability of that happening?” she continues. “So, you can take on managed risk. Through the modeling you can better understand your industry classes and what could happen within your portfolio, and can be slightly more opportunistic in areas where previously you may have been extremely cautious.” Not only does this expand the potential range of casualty insurance and reinsurance products, it should allow the industry to better support developments in burgeoning industries. “Cyber is a classic example,” says Bewlay. “If you can start to model the effects of a cyber loss you might decide you’re OK providing cyber in personal lines for individual homeowners in addition to providing cyber in a traditional business or technology environment. “You would start to model all three of these scenarios and what your potential market share would be to a particular event, and how that would impact your portfolio,” she continues. “If you can answer those questions utilizing your classic underwriting and actuarial techniques, a bit of predictive modeling in there — this is the blend of art and science — you can start taking opportunities that possibly you couldn’t before.”

Breaching the Flood Insurance Barrier
With many short-term reauthorizations of the National Flood Insurance Program, EXPOSURE considers how the private insurance market can bolster its presence in the U.S. flood arena and overcome some of the challenges it faces. According to Federal Emergency Management Agency (FEMA), as of June 30, 2017, the National Flood Insurance Program (NFIP) had around five million policies in force, representing a total in-force written premium exceeding US$3.5 billion and an overall exposure of about US$1.25 trillion. Florida alone accounts for over a third of those policies, with over 1.7 million in force in the state, representing premiums of just under US$1 billion. However, with the RMS Exposure Source Database estimating approximately 85 million residential properties alone in the U.S., the NFIP only encompasses a small fraction of the overall number of properties exposed to flood, considering floods can occur throughout the country. Factors limiting the reach of the program have been well documented: the restrictive scope of NFIP policies, the fact that mandatory coverage applies only to special flood hazard plains, the challenges involved in securing elevation certificates, the cost and resource demands of conducting on-site inspections, the poor claims performance of the NFIP, and perhaps most significant the refusal by many property owners to recognize the threat posed by flooding. At the time of writing, the NFIP is once again being put to the test as Hurricane Harvey generates catastrophic floods across Texas. As the affected regions battle against these unprecedented conditions, it is highly likely that the resulting major losses will add further impetus to the push for a more substantive private flood insurance market. The Private Market Potential While the private insurance sector shoulders some of the flood coverage, it is a drop in the ocean, with RMS estimating the number of private flood policies to be around 200,000. According to Dan Alpay, line underwriter for flood and household at Hiscox London Market, private insurers represent around US$300 to US$400 million of premium — although he adds that much of this is in “big- ticket policies” where flood has been included as part of an all-risks policy. “In terms of stand-alone flood policies,” he says, “the private market probably only represents about US$100 million in premiums — much of which has been generated in the last few years, with the opening up of the flood market following the introduction of the Biggert-Waters Flood Insurance Reform Act of 2012 and the Homeowner Flood Insurance Affordability Act of 2014.” But it is clear therefore that the U.S. flood market represents one of the largest untapped insurance opportunities in the developed world, with trillions of dollars of property value at risk across the country. “It is extremely rare to have such a huge potential market like this,” says Alpay, “and we are not talking about a risk that the market does not understand. It is U.S. catastrophe business, which is a sector that the private market has extensive experience in. And while most insurers have not provided specific cover for U.S. flood before, they have been providing flood policies in many other countries for many years, so have a clear understanding of the peril characteristics. And I would also say that much of the experience gained on the U.S. wind side is transferable to the flood sector.” Yet while the potential may be colossal, the barriers to entry are also significant. First and foremost, there is the challenge of going head-to-head with the NFIP itself. While there is concerted effort on the part of the U.S. government to facilitate a greater private insurer presence in the flood market as part of its reauthorization, the program has presided over the sector for almost 50 years and competing for those policies will be no easy task. “The main problem is changing consumer behavior,” believes Alpay. “How do we get consumers who have been buying policies through the NFIP since 1968 to appreciate the value of a private market product and trust that it will pay out in the event of a loss? While you may be able to offer a product that on paper is much more comprehensive and provides a better deal for the insured, many will still view it as risky given their inherent trust in the government.” For many companies, the aim is not to compete with the program, but rather to source opportunities beyond the flood zones, accessing the potential that exists outside of the mandatory purchase requirements. But to do this, property owners who are currently not located in these zones need to understand that they are actually in an at-risk area and need to consider purchasing flood cover. This can be particularly challenging in locations where homeowners have never experienced a damaging flood event. Another market opportunity lies in providing coverage for large industrial facilities and high-value commercial properties, according to Pete Dailey, vice president of product management at RMS. “Many businesses already purchase NFIP policies,” he explains, “in fact those with federally insured mortgages and locations in high-risk flood zones are required to do so. “However,” he continues, “most businesses with low-to-moderate flood risk are unaware that their business policy excludes flood damage to the building, its contents and losses due to business interruption. Even those with NFIP coverage have a US$500,000 limit and could benefit from an excess policy. Insurers eager to expand their books by offering new product options to the commercial lines will facilitate further expansion of the private market.” Assessing the Flood Level But to be able to effectively target this market, insurers must first be able to ascertain what the flood exposure levels really are. The current FEMA flood mapping database spans 20,000 individual plains. However, much of this data is out of date, reflecting limited resources, which, coupled with a lack of consistency in how areas have been mapped using different contractors, means their risk assessment value is severely limited. While a proposal to use private flood mapping studies instead of FEMA maps is being considered, the basic process of maintaining flood plain data is an immense problem given the scale. With the U.S. exposed to flood in virtually every location, this makes it a high-resolution peril, meaning there is a long list of attributes and inter-dependent dynamic factors influencing what flood risk in a particular area might be. With 100 years of scientific research, the physics of flooding itself is well understood, the issue has been generating the data and creating the model at sufficient resolution to encompass all of the relevant factors from an insurance perspective. In fact, to manage the scope of the data required to release the RMS U.S. Flood Hazard Maps for a small number of return periods required the firm to build a supercomputer, capitalizing on immense Cloud-based technology to store and manage the colossal streams of information effectively. With such data now available, insurers are in a much better position to generate functional underwriting maps – FEMA maps were never drawn up for underwriting purposes. The new hazard maps provide actual gradient and depth of flooding data, to get away from the ‘in’ or ‘out’ discussion, allowing insurers to provide detail, such as if a property is exposed to two to three feet of flooding at a 1-in-100 return period. No Clear Picture Another hindrance to establishing a clear flood picture is the lack of a systematic database of the country’s flood defense network. RMS estimates that the total network encompasses some 100,000 miles of flood defenses; however, FEMA’s levy network accounts for approximately only 10 percent of this. Without the ability to model existing flood defenses accurately, higher frequency, lower risk events are overestimated. To help counter this lack of defense data, RMS developed the capability within its U.S. Inland Flood HD Model to identify the likelihood of such measures being present and, in turn, assess the potential protection levels. Data shortage is also limiting the potential product spectrum. If an insurer is not able to demonstrate to a ratings agency or regulator what the relationship between different sources of flood risk (such as storm surge and river flooding) is for a given portfolio, then it could reduce the range of flood products they can offer. Insurers also need the tools and the data to differentiate the more complicated financial relationships, exclusions and coverage options relative to the nature of the events that could occur. Launching into the Sector In May 2016, Hiscox London Market launched its FloodPlus product into the U.S. homeowners sector, following the deregulation of the market. Distributed through wholesale brokers in the U.S., the policy is designed to offer higher limits and a wider scope than the NFIP. “We initially based our product on the NFIP policy with slightly greater coverage,” Alpay explains, “but we soon realized that to firmly establish ourselves in the market we had to deliver a policy of sufficient value to encourage consumers to shift from the NFIP to the private market. “As we were building the product and setting the limits,” he continues, “we also looked at how to price it effectively given the lack of granular flood information. We sourced a lot of data from external vendors in addition to proprietary modeling which we developed ourselves, which enabled us to build our own pricing system. What that enabled us to do was to reduce the process time involved in buying and activating a policy from up to 30 days under the NFIP system to a matter of minutes under FloodPlus.” This sort of competitive edge will help incentivize NFIP policyholders to make a switch. “We also conducted extensive market research through our coverholders,” he adds, “speaking to agents operating within the NFIP system to establish what worked and what didn’t, as well as how claims were handled.” “We soon realized that to firmly establish ourselves … we had to deliver a policy of sufficient value to encourage consumers to shift from the NFIP to the private market” Dan Alpay Hiscox London Market Since launch, the product has been amended on three occasions in response to customer demand. “For example, initially the product offered actual cash value on contents in line with the NFIP product,” he adds. “However, after some agent feedback, we got comfortable with the idea of providing replacement cost settlement, and we were able to introduce this as an additional option which has proved successful.” To date, coverholder demand for the product has outstripped supply, he says. “For the process to work efficiently, we have to integrate the FloodPlus system into the coverholder’s document issuance system. So, given the IT integration process involved plus the education regarding the benefits of the product, it can’t be introduced too quickly if it is to be done properly.” Nevertheless, growing recognition of the risk and the need for coverage is encouraging to those seeking entry into this emerging market. A Market in the Making The development of a private U.S. flood insurance market is still in its infancy, but the wave of momentum is building. Lack of relevant data, particularly in relation to loss history, is certainly dampening the private sector’s ability to gain market traction. However, as more data becomes available, modeling capabilities improve, and insurer products gain consumer trust by demonstrating their value in the midst of a flood event, the market’s potential will really begin to flow. “Most private insurers,” concludes Alpay, “are looking at the U.S. flood market as a great opportunity to innovate, to deliver better products than those currently available, and ultimately to give the average consumer more coverage options than they have today, creating an environment better for everyone involved.” The same can be said for the commercial and industrial lines of business where stakeholders are actively searching for cost savings and improved risk management. Climate Complications As the private flood market emerges, so too does the debate over how flood risk will adjust to a changing climate. “The consensus today among climate scientists is that climate change is real and that global temperatures are indeed on the rise,” says Pete Dailey, vice president of product management at RMS. “Since warmer air holds more moisture, the natural conclusion is that flood events will become more common and more severe. Unfortunately, precipitation is not expected to increase uniformly in time or space, making it difficult to predict where flood risk would change in a dramatic way.” Further, there are competing factors that make the picture uncertain. “For example,” he explains, “a warmer environment can lead to reduced winter snowpack, and, in turn, reduced springtime melting. Thus, in regions susceptible to springtime flooding, holding all else constant, warming could potentially lead to reduced flood losses.” For insurers, these complications can make risk selection and portfolio management more complex. “While the financial implications of climate change are uncertain,” he concludes, “insurers and catastrophe modelers will surely benefit from climate change research and byproducts like better flood hazard data, higher resolution modeling and improved analytics being developed by the climate science community.”


The Lay of The Land
China has made strong progress in developing agricultural insurance and aims to continually improve. As farming practices evolve, and new capabilities and processes enhance productivity, how can agricultural insurance in China keep pace with trending market needs? EXPOSURE investigates. The People’s Republic of China is a country of immense scale. Covering some 9.6 million square kilometers (3.7 million square miles), just two percent smaller than the U.S., the region spans five distinct climate areas with a diverse topography extending from the lowlands to the east and south to the immense heights of the Tibetan Plateau. Arable land accounts for approximately 135 million hectares (521,238 square miles), close to four times the size of Germany, feeding a population of 1.3 billion people. In total, over 1,200 crop varieties are cultivated, ranging from rice and corn to sugar cane and goji berries. In terms of livestock, some 20 species covering over 740 breeds are found across China; while it hosts over 20,000 aquatic breeds, including 3,800 types of fish.1 A Productive Approach With per capita land area less than half of the global average, maintaining agricultural output is a central function of the Chinese government, and agricultural strategy has formed the primary focus of the country’s “No. 1 Document” for the last 14 years. To encourage greater efficiency, the central government has sought to modernize methods and promote large-scale production, including the creation of more agriculture cooperatives, including a doubling of agricultural machinery cooperatives encouraging mechanization over the last four years.2 According to the Ministry of Agriculture, by the end of May 2015 there were 1.393 million registered farming cooperatives, up 22.4 percent from 2014 — a year that saw the government increase its funding for these specialized entities by 7.5 percent to ¥2 billion (US$0.3 billion). Changes in land allocation are also dramatically altering the landscape. In April 2017, the minister of agriculture, Han Changfu, announced plans to assign agricultural production areas to two key functions over the next three years, with 900 million mu (60 million hectares) for primary grain products, such as rice and wheat, and 238 million mu (16 million hectares) for five other key products, including cotton, rapeseed and natural rubber. Productivity levels are also being boosted by enhanced farming techniques and higher-yield crops, with new varieties of crop including high-yield wheat and “super rice” increasing annual tonnage. Food grain production has risen from 446 million tons in 1990 to 621 million tons in 2015.3 The year 2016 saw a 0.8 percent decline — the first in 12 years — but structural changes were a contributory factor. Insurance Penetration China is one of the most exposed regions in the world to natural catastrophes. Historically, China has repeatedly experienced droughts with different levels of spatial extent of damage to crops, including severe widespread droughts in 1965, 2000 and 2007. Frequent flooding also occurs, but with development of flood mitigation schemes, flooding of crop areas is on a downward trend. China has, however, borne the brunt of one the costliest natural catastrophes to date in 2017, according to Aon Benfield,4 with July floods along the Yangtze River basin causing economic losses topping US$6.4 billion. The 2016 summer floods caused some US$28 billion in losses along the river;5 while flooding in northeastern China caused a further US$4.7 billion in damage. Add drought losses of US$6 billion and the annual weather-related losses stood at US$38.7 billion.6 However, insured losses are a fraction of that figure, with only US$1.1 billion of those losses insured. “Often companies not only do not know where their exposures are, but also what the specific policy requirements for that particular region are in relation to terms and conditions” Laurent Marescot RMS The region represents the world’s second largest agricultural insurance market, which has grown from a premium volume of US$100 million in 2006 to more than US$6 billion in 2016. However, government subsidies — at both central and local level — underpin the majority of the market. In 2014, the premium subsidy level ranged from between 65 percent and 80 percent depending on the region and the type of insurance. Most of the insured are small acreage farms, for which crop insurance is based on a named peril but includes multiple peril cover (drought, flood, extreme winds and hail, freeze and typhoon). Loss assessment is generally performed by surveyors from the government, insurers and an individual that represents farmers within a village. Subsidized insurance is limited to specific crop varieties and breeds and primarily covers only direct material costs, which significantly lowers its appeal to the farming community. One negative impact of current multi-peril crop insurance is the cost of operations, thus reducing the impact of subsidies. “Currently, the penetration of crop insurance in terms of the insured area is at about 70 percent,” says Mael He, head of agriculture, China, at Swiss Re. “However, the coverage is limited and the sum insured is low. The penetration is only 0.66 percent in terms of premium to agricultural GDP. As further implementation of land transfer in different provinces and changes in supply chain policy take place, livestock, crop yield and revenue insurance will be further developed.” As He points out, changing farming practices warrant new types of insurance. “For the cooperatives, their insurance needs are very different compared to those of small household farmers. Considering their main income is from farm production, they need insurance cover on yield or event-price-related agricultural insurance products, instead of cover for just production costs in all perils.” At Ground Level Given low penetration levels and limited coverage, China’s agricultural market is clearly primed for growth. However, a major hindering factor is access to relevant data to inform meaningful insurance decisions. For many insurers, the time series of insurance claims is short, government-subsidized agriculture insurance only started in 2007, according to Laurent Marescot, senior director, market and product specialists at RMS. “This a very limited data set upon which to forecast potential losses,” says Marescot. “Given current climate developments and changing weather patterns, it is highly unlikely that during that period we have experienced the most devastating events that we are likely to see. It is hard to get any real understanding of a potential 1-in-100 loss from such data.” Major changes in agricultural practices also limit the value of the data. “Today’s farming techniques are markedly different from 10 years ago,” states Marescot. “For example, there is a rapid annual growth rate of total agricultural machinery power in China, which implies significant improvement in labor and land productivity.” Insurers are primarily reliant on data from agriculture and finance departments for information, says He. “These government departments can provide good levels of data to help insurance companies understand the risk for the current insurance coverage. However, obtaining data for cash crops or niche species is challenging.” “You also have to recognize the complexities in the data,” Marescot believes. “We accessed over 6,000 data files with government information for crops, livestock and forestry to calibrate our China Agricultural Model (CAM). Crop yield data is available from the 1980s, but in most cases it has to be calculated from the sown area. The data also needs to be processed to resolve inconsistencies and possibly de-trended, which is a fairly complex process. In addition, the correlation between crop yield and loss is not great as loss claims are made at a village level and usually involve negotiation.” A Clear Picture Without the right level of data, international companies operating in these territories may not have a clear picture of their risk profile. “Often companies not only have a limited view where their exposures are, but also of what the specific policy requirements for that particular province are in relation to terms and conditions,” says Marescot. “These are complex as they vary significantly from one line of business and province to the next.” A further level of complexity stems from the fact that not only can data be hard to source, but in many instances it is not reported on the same basis from province to province. This means that significant resource must be devoted to homogenizing information from multiple different data streams. “We’ve devoted a lot of effort to ensuring the homogenization of all data underpinning the CAM,” Marescot explains. “We’ve also translated the information and policy requirements from Mandarin into English. This means that users can either enter their own policy conditions into the model or rely upon the database itself. In addition, the model is able to disaggregate low-resolution exposure to higher-resolution information, using planted area data information. All this has been of significant value to our clients.” The CAM covers all three lines of agricultural insurance — crop, livestock and forestry. A total of 12 crops are modeled individually, with over 60 other crop types represented in the model. For livestock, CAM covers four main perils: disease, epidemics, natural disasters and accident/fire for cattle, swine, sheep and poultry. The Technology Age As efforts to modernize farming practices continue, so new technologies are being brought to bear on monitoring crops, mapping supply and improving risk management. “More farmers are using new technology, such as apps, to track the growing conditions of crops and livestock and are also opening this to end consumers so that they can also monitor this online and in real-time,” He says. “There are some companies also trying to use blockchain technology to track the movements of crops and livestock based on consumer interest; for instance, from a piglet to the pork to the dumpling being consumed.” He says, “3S technology — geographic information sciences, remote sensing and global positioning systems — are commonly used in China for agriculture claims assessments. Using a smartphone app linked to remote control CCTV in livestock farms is also very common. These digital approaches are helping farmers better manage risk.” Insurer Ping An is now using drones for claims assessment. There is no doubt that as farming practices in China evolve, the potential to generate much greater information from new data streams will facilitate the development of new products better designed to meet on-the-ground requirements. He concludes: “China can become the biggest agricultural insurance market in the next 10 years. … As the Chinese agricultural industry becomes more professional, risk management and loss assessment experience from international markets and professional farm practices could prove valuable to the Chinese market.” References: 1. Ministry of Agriculture of the People’s Republic of China 2. Cheng Fang, “Development of Agricultural Mechanization in China,” Food and Agriculture Organization of the United Nations, https://forum2017.iamo.de/microsites/forum2017.iamo.de/fileadmin/presentations/B5_Fang.pdf 3. Ministry of Agriculture of the People’s Republic of China 4. Aon Benfield, “Global Catastrophe Recap: First Half of 2017,” July 2017, http://thoughtleadership.aonbenfield.com/Documents/201707-if-1h-global-recap.pdf 5. Aon Benfield, “2016 Annual Global Climate and Catastrophe Report,” http://thoughtleadership.aonbenfield.com/Documents/20170117-ab-ifannualclimate-catastrophe-report.pdf 6. Ibid. The Disaster Plan In April 2017, China announced the launch of an expansive disaster insurance program spanning approximately 200 counties in the country’s primary grain producing regions, including Hebei and Anhui. The program introduces a new form of agriculture insurance designed to provide compensation for losses to crop yields resulting from natural catastrophes, including land fees, fertilizers and crop-related materials. China’s commitment to providing robust disaster cover was also demonstrated in 2016, when Swiss Re announced it had entered into a reinsurance protection scheme with the government of Heilongjiang Province and the Sunlight Agriculture Mutual Insurance Company of China — the first instance of the Chinese government capitalizing on a commercial program to provide cover for natural disasters. The coverage provides compensation to farming families for both harm to life and damage to property as well as income loss resulting from floods, excessive rain, drought and low temperatures. It determines insurance payouts based on triggers from satellite and meteorological data. Speaking at the launch, Swiss Re president for China John Chen said: “It is one of the top priorities of the government bodies in China to better manage natural catastrophe risks, and it has been the desire of the insurance companies in the market to play a bigger role in this sector. We are pleased to bridge the cooperation with an innovative solution and would look forward to replicating the solutions for other provinces in China.”
